Journal of Financial Planning: December 2011
Executive Summary
- Investments in retirement accounts are plagued by poor returns. An important factor is that, in aggregate, returns of actively managed equity mutual funds trail those of broad market indices.
- This paper partitions the real total return of the S&P 500 into: (1) return to mutual fund investors and (2) return to the financial services industry. The author calculates these shares for all 10-, 20-, 30-, 40-, and 50-year investment periods using data from January 1871 to June 2011.
- The financial services industry share of market returns increases with the length of investment period. For annual performance lags of 250 basis points (bps), the industry share over 10 years is about 46 percent on average; over 50 years it increases to 74 percent.
- Smaller degrees of underperformance increase investor shares substantially: 50-bp lags result in an average investor share of 90 percent for 10-year investment periods and 77 percent after 50 years.
- The shares of market returns to investors and the financial services industry are highly variable for shorter investment periods, but this variability declines as the investment period increases.
- A 100-bp annual lag in performance over 50 years would reduce retirement assets currently held in equities by about $28 trillion (inflation adjusted), an amount almost twice that of the entire U.S. national debt as it currently stands, assuming average market returns.
- The author recommends that pension plan fiduciaries be required to select default investments with a management expense ratio (MER) as low as possible, ideally no greater than 10 bps. Also, financial advisers should direct client funds to similarly low-cost investment vehicles.
Stewart Neufeld, Ph.D., is an assistant professor at the Institute of Gerontology at Wayne State University in Detroit, Michigan.
Fifty-one percent of individuals’ retirement savings held in tax-deferred accounts such as individual retirement accounts (IRAs), 401(k) plans, or 403(b) plans are invested in mutual funds (Investment Company Institute 2011). Questions about the adequacy of accumulated assets in retirement accounts led to the Pension Protection Act of 2006, which aimed to increase contributions to retirement plans by allowing, for example, automatic enrollment, escalation, and default investment allocation (Munnell, Aubry, and Muldoon 2009).
However, the problem of inadequate retirement savings exists not only because of low contribution levels by individuals but also low returns on the savings invested—a long-standing problem that has been largely ignored. The reasons for these low returns are varied, including poor investor decision making (De Bondt 1998). However, a key factor is the poor performance relative to broad market indices delivered by mutual funds that manage fully half of retirement savings. A considerable body of research has shown that a typical mutual fund underperforms its relevant benchmark index by approximately the amount of its fees levied and expenses incurred (Malkiel 1995; Chalmers, Edelen, and Kadlec 1999). The annual difference between the market return (for example, S&P 500) and that of the typical mutual fund may appear minor; however, the difference compounds over time and results in significant gaps between market returns and actual accumulation in retirement accounts.
The problem for policy makers is that the long-term effects of poor mutual fund performance on investment returns are not well documented and therefore not well understood. We have not, for example, fully used past market experience to model the likely gap between market returns and that of the typical mutual fund over time frames relevant to individuals saving and investing for retirement. As a direct result—and despite the fact that it is widely acknowledged among academics, investment professionals, and policy makers that mutual fund fees and expenses are important factors that reduce returns in retirement plans—there has been little impetus for either industry or policy reform. The bottom line is, mutual fund cost structures contribute substantially to inadequate accumulations in retirement accounts.
To better understand the effect of mutual fund performance lags on these accumulations, it is useful to partition market returns into two parts: a share that accrues to mutual fund investors and a share that goes to the mutual fund companies themselves along with other elements of the financial services industry. This paper estimates how stock market returns are allocated between investors and the financial services industry (hereafter industry) over various time frames (10–50 years) and for several lags in fund returns relative to a broad market index, the S&P 500.
Background
Assets Held in Retirement Accounts. Retirement coverage of any type (defined benefit, defined contribution, IRA) has remained relatively constant since 1989 at about 60 percent of workers (Mackenzie and Wu 2008). However, the composition of plans for workers who have them has changed dramatically. Over the past two decades, the number of workers enrolled in defined-benefit plans has declined, and defined-contribution plans such as 401(k) plans, 403(b) plans, and individual retirement accounts (IRAs) have proliferated. Among workers with pension coverage, the proportion with only a defined-benefit plan declined from 62 percent in 1983 to 17 percent in 2007. Over the same period, workers with only defined-contribution plans increased from 12 percent to 63 percent (Munnell, Golub-Sass, and Muldoon 2008). The percentage of workers with both kinds of pension plans remained relatively steady at about 20 percent. Thus, an increasing proportion of assets is in retirement accounts individuals manage for themselves.
In a recent report, the Investment Company Institute (2011) detailed the value of assets in U.S. retirement accounts, including the proportion held in mutual funds by various asset classes. As of Q4 2010, U.S. retirement assets totalled $17.5 trillion, representing 37 percent of total household financial assets. Of this amount, slightly more than half ($9.2 trillion) was in defined-contribution plans or IRAs. Mutual funds represented 56 percent of assets held in defined-contribution plans and 47 percent of assets in IRAs for a total of $4.7 trillion. Most of these mutual funds are invested in stocks ($2.8 trillion), with smaller amounts in bonds ($0.7 trillion) and money markets ($0.4 trillion). The remainder ($0.9 trillion) is invested in hybrid funds that hold a combination of stocks and fixed-income investments.
Equity Mutual Fund Performance. The gross performance (before fees and expenses) of equity mutual funds over reasonably long periods (a decade or more) is unlikely to exceed that of a broad market index such as the S&P 500 for a couple of basic reasons. First, the average returns to equity investors, collectively, cannot exceed that of the market as a whole, by definition. Second, mutual funds as a group mainly compete against other professional and institutional investors, and hence, cannot be expected to perform better than them in any persistent way. On the other hand, mutual fund returns can be expected to be better than stock portfolios of individual “retail” (unsophisticated) investors, but these investors constitute a small fraction of the market as a whole. Institutional investors, which include mutual funds, own a large and growing proportion of U.S. equities. The Conference Board (2008) estimates that institutions, pension funds, investment funds, banks, and foundations own more than 77 percent of the largest 1,000 U.S. firms. This figure does not include ownership by other sophisticated investors such as hedge funds, exchange-traded funds (ETFs), and professional investors trading for their own accounts. We would expect then that gross mutual fund performance on average would be no better than the S&P 500 Index, and thus, that the return to mutual fund investors would be no better than the S&P 500 Index less average mutual fund fees and expenses.
The empirical evidence suggests that this is usually the case. However, the findings reported in the literature are varied and depend on multiple factors such as the sample of funds chosen, historical period, and investment time frame, and therefore, the degree to which mutual funds lag broad market indices is not entirely unequivocal.
In an early study, Sharpe (1966) examined a sample of 34 funds from 1954–1963 and found that on the whole these funds performed worse than the Dow Jones Industrial Average (11 better, 23 worse), even though his sample suffered from survivorship bias, for which more recent studies control. He also found that the degree of underperformance was roughly equal to their fees. Malkiel (1995) used a broad sample of equity mutual funds and showed that in the 15-year period ending in 1991, their performance lagged the S&P 500 by 3.2 percent. In addition, each percentage increase in fees resulted in a 1.92 percent decrease in performance. Chalmers et al. (1999) showed that each percentage point increase in fees resulted in at least a 1 percentage point decrease in performance, consistent with Elton, Gruber, Das, and Hlavka (1993). Chalmers et al. also found that trading costs are more detrimental to fund returns than expense ratios.
Using risk-adjusted returns, other investigators concluded that mutual funds underperform the market, but not as dramatically. For example, Gruber (1996) looked at 270 stock funds from 1984–1994 and found that their risk-adjusted returns from a single index model were about 1.56 percent less than the market each year.
Mutual Fund Fees and Expenses. Mutual fund fees and expenses can be divided into two parts: a management expense ratio (MER) easily obtained by the average investor, and a more difficult-to-ascertain set of other fees and expenses. The MER typically includes management fees, rule 12b-1 fees, and other expenses deducted from fund assets or charged to all investor accounts (U.S. Securities and Exchange Commission 2000). These other expenses include payments to transfer agents, securities custodians, providers of shareholder accounting services, attorneys, auditors, and fund-independent directors. Not included in the MER, and therefore part of the second set of fees and expenses, are front-end and back-end loads, trading costs (broker commissions, bid-ask spreads), wrap fees, minimum balance fees, transfer fees, and other financial advice/planning fees if they are paid separately by the individual investor. Of these, trading costs and load fees represent the largest components.
Estimates of average MERs reported in the literature are slightly more than 1 percent in studies published in the 1990s (for example, 1.13 percent in Gruber 1996; 1.08 percent in Carhart 1997; 1.07 percent in Chalmers et al. 1999), but have been shown by more recent research to be somewhat higher and also generally trending upward from at least the 1970s. The 2000 SEC study found that asset-weighted expense ratios increased from 73 bps in 1979 to 94 bps in 1999, although its sample of funds included index funds, which have lower costs (average 45 bps lower). In a study by Ennis (2005), average equity mutual fund expense ratios were found to have risen from 96 bps in 1980 to 156 bps in 2004. In contrast, the 2011 Investment Company Institute study reports that the average MER for 2010 is 84 bps and trending downward (asset weighted, including index funds).
Fewer studies have investigated expenses not included in the MER. Karceski, Livingston, and O’Neal (2004) found that trading costs (commissions plus implicit trading costs) for domestic actively traded funds averaged 40 bps in 2002 for a total cost of 152 bps (MER of 112 bps). Chalmers et al. (1999) found that in a sample of 132 funds from 1984 through 1991, trading costs averaged 78 bps per year (brokerage commissions of 31 bps, spread costs of 47 bps), for a total fund cost of about 185 bps on average (MER of 107 bps). More recent data suggest that trading costs are much higher than previously thought. Edelen, Evans, and Kadlec (2009), in a survey of 1,758 U.S. equity funds, found that trading costs were 144 bps, which together with an average MER of 119 bps, renders a total annual fund cost of 263 bps. These estimates of total fund cost ignore front-end and back-end loads in their calculations. The SEC estimated the impact of loads in its 2000 study and found that they increased the expense ratio by 94 bps (5-year amortization) or 58 bps (10-year amortization). Thus, current estimates of total fund ownership costs for domestic actively traded equity funds range from about 200–300 bps per year, with 250 bps being a reasonable mid-point estimate (MER of 150 bps; other fees and expenses equal to 100 bps).
Effects of Mutual Fund Underperformance on Investment Returns. Some modest efforts have been made to estimate how mutual fund performance lagging broad market indices affects investment accumulations. For example, numerous financial commentators have posted tables and figures of final portfolio values under various assumptions of annual returns, mutual fund fees, and investment periods.1 In addition, several calculators have been developed to assist individuals in estimating the effects of mutual fund fees on their savings accumulations. The U.S. Securities and Exchange Commission (SEC) calculator2 asks the user to enter the return he or she expects, the mutual fund expense ratio, the amount of the initial investment, and the investment period. Based on this information, it calculates a total accumulated value and the total cost to the investor. The Financial Industry Regulatory Authority (FINRA) calculator3 differs from the SEC calculator in that it asks the user for the names of up to three mutual funds and retrieves the actual expense ratios from a database. A calculator provided by the Vanguard Group4 is similar to the FINRA calculator; the main difference is that Vanguard provides a comparison with the average domestic equity fund, which the company asserts has an expense ratio of 1.81 percent.
Although these tables and calculators found on various websites may be of use to some individuals, they do not provide a realistic assessment of the impact of mutual fund performance on retirement savings for several reasons. First, they incorporate user-defined returns that may be completely unrelated to actual market performance. Second, they use nominal returns when it is real returns that matter to investors. Third, they include only mutual fund MERs and ignore other important expenses such as trading costs. Fourth, they focus on accumulated investment totals (which include principal contributed), not on gains (and losses) and how these gains (and losses) are apportioned between investors and the financial services industry.
Methodology
Benchmark Index. I choose the S&P 500 as the benchmark index for equities. The S&P 500 is a broad market index that represents 75 percent of U.S. market capitalization (Standard & Poor’s 2009). Although the S&P 500 is not as broad as the Wilshire 5000, it has the advantage of being widely tracked, is often taken by investors to represent the market, and has a long history. The returns of the S&P 500 can be closely replicated through low-cost index funds with small tracking errors.
Description of Data Source. An S&P 500 database has been constructed and made available by Robert Shiller (www.econ.yale.edu/~shiller/data.htm). This database contains monthly prices and dividends from January 1871 to the present, with prices updated monthly and dividends updated quarterly. S&P 500 price data are monthly averages of daily closing prices. The monthly dividend data represent an annual dividend amount computed from the S&P four-quarter totals since 1926, with linear interpolation to monthly figures. The annual dividend yield is the monthly dividend amount divided by the monthly price. Dividend data before 1926 are from Cowles (1939), interpolated from annual data.
The Shiller database also contains the Consumer Price Index-All Urban Consumers (CPI-U) series. The CPI-U is published by the U.S. Bureau of Labor Statistics and begins in 1913. The CPI for years prior to 1913 was computed by splicing the Warren and Pearson’s price index to the CPI. More information on the construction of this database is available on the website cited above.
Calculation of S&P 500 Index and Mutual Fund Returns. The return on the S&P 500 in month i is equal to the rate of increase in the index ri plus the dividend yield di. I assume in the analysis that all dividends are immediately reinvested. The rate of increase in the S&P 500 is ri = (Si - Si-1)/Si-1, where Si is the value of the index in month i. The dividend yield is di = Di/Si/12, where Di is the annual dividend amount computed for month i.
The aggregate mutual fund return in month i is equal to ri + di - fi where fi is the rate of mutual fund underperformance relative to the S&P 500 in month i. In my analysis I assume fi = f, a constant, and f = F/12 where f is the annual rate of underperformance.
The real total return, RN(j), of the S&P 500 over a period of N > 0 months starting from month j – 1 can be calculated as follows:
where Ci is the CPI for month i. The corresponding rate of return MN(j) for mutual funds is given by:

In my analysis I compute S&P 500 and mutual fund returns for all periods of 10, 20, 30, 40, and 50 years (N = 120, 240, 360, 480, and 600 months) because I believe these periods encompass the range relevant to most investors saving and investing for their retirements. If desired, mutual fund returns could be calculated using the formula above for any number of months up to 1,685 (the current number in the database). In this paper, mutual fund returns are calculated for performance lags relative to the S&P 500 of 250 bps, 100 bps, and 50 bps (f = 0.208, 0.083, 0.042), and for brevity, figures are produced for investment periods of 10, 30, and 50 years only.
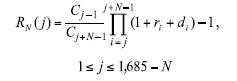
Lastly, I compute how S&P 500 returns are partitioned between investors and the financial services industry over 10, 20, 30, 40, and 50 years. The share of returns accruing to the industry is given by
where N takes on the values 120, 240, 360, 480, and 600. If PN(j) > 100, then the real total return of the S&P 500 is positive over the specified period, and the effect of mutual fund underperformance is to turn this gain into a loss of principal. If PN(j) < 0, then the real total return of the S&P 500 is negative over the specified period, and the performance lag of mutual funds serves to exacerbate this loss of principal.
Results
In this section I examine how stock market gains are divided between investors and the financial services industry, assuming three levels (250 bps, 100 bps, 50 bps) of mutual fund performance lag relative to the S&P 500. In Figure 1, I assume the real return of the S&P 500 is constant and equal to its (geometric) average over the past 140 years (6.67 percent). I then plot the accumulated return of the S&P 500 along with the three different mutual fund returns over 50 years. The difference between the S&P 500 return and the return received by mutual fund investors is the portion captured by the financial services industry.
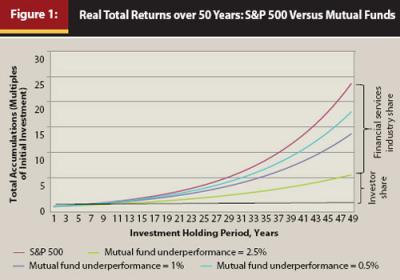
If mutual funds underperform the S&P 500 by 250 bps annually, then after 10 years the financial services industry gets about 46 percent of the market gains on average, leaving the investor with 54 percent (Figure 1). Mutual fund investors fare considerably better when the level of mutual fund underperformance is only 50 bps annually—investors receive on average 82 percent of market gains over a 10-year time frame. As the investment period lengthens, the proportion of market gains that go to the industry becomes larger. For example, if mutual fund performance lags that of the S&P 500 by 250 bps annually over a 50-year investment period, the financial services industry captures about 74 percent of the market gains on average (Figure 1). If the performance lag is only 50 bps annually, then the proportion of market gains accruing to the industry after 50 years is about 23 percent.
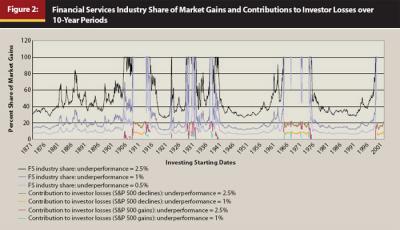
I assumed in Figure 1 that the real return on the S&P 500 was constant and equal to the long-term average. However, market returns are highly variable, and therefore the proportion of market gains that go to mutual fund investors versus the financial services industry depends not only on the degree to which mutual funds lag the S&P 500 and the length of the investment period but also on the historical time at which the investment is made. Figures 2–4 show the share of market gains accruing to the financial services industry for investment periods of 10, 30, and 50 years. In these figures this proportion has been truncated at 100 percent (the industry takes all of the gains), which occurs when the S&P 500 gains little or declines over the specified period. In cases in which the S&P 500 gains a small amount, I show the percentage loss of principal mutual fund investors experience. In cases in which the S&P 500 declines over the specified investment period, I show the additional losses of principal that result from mutual fund performance lags.
Figure 2 charts the share of market gains that flow to the financial services industry over all 10-year periods. When mutual fund underperformance relative to the S&P 500 is 250 bps annually, the proportion accruing to the industry is typically about 35 percent, although highly variable. However, in some periods (investments initiated between 1905–1915, 1928–1931, 1937–1939, 1964–1974, and 1998–2001), some of which are quite extended, investors received almost none of the market gains and often experienced losses. When the S&P 500 posted small gains over the 10-year period, investor losses ranged from 0–20 percent. When the market declined over the 10-year period, investors in mutual funds typically lost an additional 20 percent (see Figure 2). A similar pattern is evident when mutual funds lag the S&P 500 by 100 bps and 50 bps, except that the typical proportion of market gains flowing to the industry is lower (about 15 percent and 10 percent), the periods of portfolio losses are somewhat shorter, and the magnitude of the losses is less when they occur.
Figures 3 and 4 repeat the analysis depicted in Figure 2 for investment periods of 30 and 50 years. There are very few starting months in which the market produces a loss over a 20-year period (data not shown). However, investors in mutual funds that lag the S&P 500 by 250 bps annually would have experienced losses over 20 years in four different periods, that is, if they had initiated their investment in the five-year period starting in 1898, 1912–1913, in the two years prior to the Great Depression, or in the 10-year period starting in 1958. Note that a performance lag of 50 bps would produce essentially no losses over any 20-year investment period, although there would be a few years in which the gain would be close to zero.
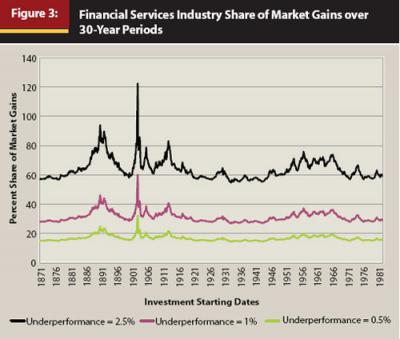

Figures 2–4 show that the share of market gains that accrue to the industry increases with the length of investment period. For example, if we assume the mutual fund performance lag relative to the S&P 500 is 250 bps per year, then the industry share over a 30-year investment period is 63 percent, over 40 years it is 69 percent, and over 50 years the industry gets 74 percent. The variance of the shares to investors and the industry decreases as the length of the investment period increases, and if the investment period is quite long (for example, ≥ 40 years), these shares are largely independent of the time of investment initiation. Finally, the degree to which the performance of mutual funds lags that of the S&P 500 is hugely influential on how market gains are divided between investors and the industry. For example, over a 30-year investment period a performance lag of 50 bps results in the industry capturing 16 percent of market gains versus 63 percent if the level of underperformance were 250 bps, as noted above. Over a 50-year investment period, the gap is slightly wider: 23 percent versus 74 percent.
Conclusion
In this paper I have investigated how stock market gains are shared between mutual fund investors and the financial services industry as a function of mutual fund underperformance relative to the S&P 500. I found that a performance lag of 250 bps versus 50 bps substantially changes the proportions going to investors and the industry. I also found that the share to the industry increases with the length of the investment period. Over a 50-year investment period, investors could triple their returns simply by investing in mutual funds that lag the S&P 500 by 50 bps rather than 250 bps; for an initial investment of $10,000, this means a gain of $134,000 rather than $45,000. Differences of this magnitude can meaningfully affect the quality of life in retirement.
Instead of focusing on individual investors, we can also consider the growth of retirement account assets in aggregate and the effect of mutual fund underperformance on total accumulations. The current value of equity mutual fund assets in IRAs and defined-contribution plans is about $2.8 trillion (Investment Company Institute 2011). Assuming historical market returns, this amount would increase to $71 trillion (inflation adjusted) over 50 years. A performance lag relative to the S&P 500 of 250 bps annually would leave investors with about $20 trillion in their retirement accounts, a difference of market versus achieved returns of $51 trillion. To put this into perspective, this potential loss to investors is several times larger than the entire U.S. national debt, as it currently stands. An additional $51 trillion in retirement accounts over the next several decades would contribute significantly to solving the problem of inadequate retirement savings.
The Pension Protection Act of 2006 provided for automatic enrollment in defined-contribution plans such as 401(k) plans and the selection of default investments by plan fiduciaries on behalf of participants who do not elect to direct their contributions. Although the Department of Labor (2007) has published regulations that specify the types of investments that qualify for default portfolios, it has remained largely silent on the matter of mutual fund fees and expenses, except to say plan fiduciaries “must carefully consider investment fees and expenses when choosing a qualified default investment alternative.” Thus, there is no prohibition on plan fiduciaries selecting investments with fee structures typical for the industry. However, as I have shown in this paper, typical mutual fund fees and expenses can be extremely destructive to investors’ portfolios, and even relatively low-cost mutual funds (total fees and expenses equal to 50 bps) can reduce investors’ returns significantly over time.
Note that mutual funds that track broad market indices such as the S&P 500 are readily available for a total cost of much less than 50 bps; indeed funds that track the S&P 500 with an MER of less than 10 bps are not uncommon and can be purchased by individual investors from several major mutual fund companies. A difficulty is that funds like these are not necessarily available to investors in their particular tax-deferred retirement accounts.
On the basis of the research presented here, I recommend that pension plan fiduciaries be required to select default investments that track broad market indices (equity, money, bond) and that have total fees (MERs) as low as possible, ideally not more than 10 bps. For this to be effectively implemented, an additional requirement is that investments with these characteristics be made available in all tax-deferred retirement plans. If this were a legal requirement, then competition in the marketplace would ensure that many low-cost funds would be formed for potential inclusion in retirement plans. In the meantime, pension plan fiduciaries should work to structure their plans so that more low-cost funds are included.
Investment advisers should also direct clients to low-cost (ideally < 10 bps) index funds unless this approach contravenes the client’s expressly stated investment objectives. To do otherwise is to act against the best interests of the client. Among the general public, financial education is weak and financial literacy is low, and therefore it is easy for advisers to recommend investments that primarily benefit themselves and not their clients. A contribution of this research is to demonstrate the extent to which various levels of fees and expenses are damaging to clients’ portfolios and therefore which investments should be avoided by ethical advisers.
Endnotes
- Examples of such tables and figures can be found here: http://buyupside.com/mutual funds/mutualfundfees.htm, http://moneyning.com/investing/the-impact-of-costs-on-mutual-fund-returns.
- SEC Mutual Fund Cost Calculator: http://www.sec.gov/investor/tools/mfcc/get-started.htm..
- FINRA Fund Analyzer: http://apps.finra.org/fundanalyzer/1/fa.aspx.
- Vanguard tool for comparing fund costs: https://personal.vanguard.com/us/funds/tools/costcompare.
References
Carhart, M. 1997. “On Persistence in Mutual Fund Performance.” Journal of Finance 52, 1: 57–82.
Chalmers, J., R. Edelen, and G. Kadlec. 1999. “An Analysis of Mutual Fund Trading Costs.” Working paper (November).
Conference Board. 2008. “U.S. Institutional Investors Boost Ownership of U.S. Corporations to New Highs.” www.conference-board.org/utilities/pressdetail.cfm?press_id=3466.
Cowles, Alfred, and Associates. 1939. Common Stock Indexes. 2nd ed. Bloomington, IN: Principia Press.
De Bondt, W. 1998. “A Portrait of the Individual Investor.” European Economic Review 42: 831–844.
Edelen, R., R. Evans, and G. Kadlec. 2009. “Trading Costs: What You Don’t See Can Hurt Your Returns.” Paper presented at the Morningstar Investment Conference, Chicago (May).
Elton, E., M. Gruber, S. Das, and M. Hlavka. 1993. “Efficiency with Costly Information:
A Reinterpretation of Evidence from Managed Portfolios.” Review of Financial Studies 6, 1: 1–22.
Ennis, R. 2005. “Are Active Management Fees Too High?” Financial Analysts Journal 61, 5: 44–51.
Gruber, M. 1996. “Another Puzzle: The Growth of Actively Managed Mutual Funds.” Journal of Finance 51, 3: 783–810.
Investment Company Institute. 2011. 2011 Investment Company Factbook. 51st ed.
Karceski, J., M. Livingston, and E. O’Neal. 2004. “Portfolio Transaction Costs at U.S. Equity Mutual Funds.” Working paper (November).
Mackenzie, S., and K. Wu. 2008. The Coverage of Employer-Provided Pensions: Partial and Uncertain. Washington, DC: AARP Public Policy Institute.
Malkiel, B. 1995. “Returns from Investing in Equity Mutual Funds, 1971 to 1991.” Journal of Finance 50, 2: 549–572.
Munnell, A., F. Golub-Sass, and D. Muldoon. 2009. “An Update on 401(k) Plans: Insights from the 2007 SCF.” Boston College Center for Retirement Research Issue in Brief 9, 5.
Munnell, A., J. Aubry, and D. Muldoon. 2008. “The Financial Crisis and Private Defined-Benefit Plans.” Boston College Center for Retirement Research Issue in Brief 8, 18.
Sharpe, W. 1966. “Mutual Fund Performance.” Journal of Business 39, 1: 119–138.
Standard & Poor’s. 2009. S&P 500 Index Factsheet. www.standardandpoors.com.
U.S. Department of Labor. 2007. “Default Investment Alternatives Under Participant-Directed Individual Account Plans; Final Rule.” Federal Register 72, 205: 60452–60480.
U.S. Securities and Exchange Commission. 2000. Investment Management: Report on Mutual Fund Fees and Expenses. www.sec.gov/news/studies/feestudy.htm.