Journal of Financial Planning: June 2012
Jerry A. Miccolis, CFA, CFP®, FCAS, is a principal and the chief investment officer at Brinton Eaton, a wealth management firm in Madison, New Jersey, and a portfolio manager for The Giralda Fund. He co-authored Asset Allocation For Dummies® (Wiley, 2009) and numerous works on enterprise risk management. (miccolis@brintoneaton.com)
Marina Goodman, CFP®, is an investment strategist at Brinton Eaton and a portfolio manager for The Giralda Fund. She has been working to bridge the gap between research and practice to improve the portfolio optimization process. (goodman@brintoneaton.com)
Executive Summary
- Portfolios need a form of “protection of last resort”—so-called tail risk hedges—to help stem losses when all else fails.
- Most forms of such protection are too costly and/or ineffective according to our set of strict criteria. Examples of popular solutions, and their failings, are outlined.
- A particular class of promising solutions—those based on exploiting market volatility—are examined in detail. Practical ways to access these solutions are described.
- Combining tail risk hedges with “modernized” modern portfolio theory and dynamic asset allocation, in an integrated risk management system, is a powerful way to deliver what clients are demanding.
Over the last few years, the term “black swan” has made its way into the investment vernacular. Popularized by Nassim Taleb (2007) and adopted by financial industry pundits, the term denotes an event of potentially far-reaching consequences that was so improbable it had never yet been observed. Today, no discussion of investment risk management can be deemed complete without some consideration of protection against black swan events.
These extreme occurrences are found in the far-out “tails”1 of the probability distributions that attempt to quantify the likelihood of various uncertain financial outcomes. The tails of the distributions are the regions that represent very-low-frequency but very-high-severity eventualities. Risk management devices that attempt to protect against these eventualities are thus often termed “tail risk hedges.”2
The first of our recent Journal articles (Miccolis and Goodman 2012a) discussed how to modernize modern portfolio theory to construct better portfolios during normal markets through more informed asset allocation and rebalancing. Our second article (Miccolis and Goodman 2012b) described using momentum-based dynamic asset allocation strategies to manage through markets that experience protracted declines. This article discusses the third component of our risk management system—effective methods for hedging tail risk and taming the effects of the dreaded black swan events. We examine strategies that attempt to provide a safety net of last resort, to protect portfolios when all else fails. We also discuss practical methods of delivering these strategies to clients.
Prior research in this area has included a discussion of the need for tail risk hedges (Bhansali 2008) as well as benefits to including them in portfolios (Bhansali and Davis 2010a, 2010b). Akoundi and Haugh (2010) provide an overall framework to think about tail risk hedging. We attempt in this article to further this research by specifying practical criteria by which tail risk hedges should be judged, evaluating some popular and more-recently developed strategies against those criteria, suggesting effective ways those strategies could be integrated, and discussing how they can be accessed by financial advisers.
Criteria to Use in a Sellers’ Market
There is no lack of techniques to protect portfolios from tail risk, and there has been a proliferation of new products since the market collapse of 2008. Most of these have unacceptably excessive costs due to high fees, underperformance during normal markets, and/or limits to upside portfolio potential.
The area of designing tail risk hedging strategies is quite young and currently experiencing a burst of growth and creativity. A number of portfolio protection techniques work beautifully over the very short term, if you know exactly when to use them and when to stop. It is difficult to do this correctly on a consistent basis. Another option, discussed here, is to look for strategies that can be used over the long term. To weed out the portfolio protection techniques that would do more harm than good as buy-and-hold investments, we measure them against the following three criteria:
- Sudden appreciation in severe market downturns, with no give-back during market recoveries
- Very low cost, both direct and indirect
- Minimal disruption to the portfolio
With respect to the first of our criteria, a tail risk hedge, by definition, must appreciate significantly in severe market downturns. By “severe” we mean declines that are sudden, substantial, unexpected, and that affect most major asset classes—as occurred during the fourth quarter of 2008. We are not concerned here with protection during minor declines, especially those that affect a single asset class, because proper asset allocation and rebalancing (see, for example, Miccolis and Goodman 2012a) help us take advantage of normal gyrations in the market. Likewise, momentum-based strategies (see, for example, Miccolis and Goodman 2012b) can effectively handle substantial but gradual declines. A tail risk hedge, on the other hand, must work precisely when asset allocation, rebalancing, and momentum strategies are most vulnerable—that is, when all else fails. The hedge’s appreciation must be sufficient to meaningfully offset the portfolio’s decline. Also, and this is where many of the strategies fail, the tail risk hedge must not give back its appreciation when the market eventually recovers. Otherwise, over the market’s full cycle, little would have been achieved.
Our second criterion is low total cost. The true cost of a hedge has two components: explicit product fees and any sacrifice of portfolio appreciation. While the former is often plainly specified, the latter may be hard to identify. Many strategies do not plainly state that a portfolio’s performance may be effectively capped at a certain level.
Our third criterion is that the tail risk hedge not disrupt the rest of the portfolio. A competently designed portfolio will perform well the vast majority of the time. The goal of the hedge is to support it in the few times when the markets go haywire. It should not compromise the portfolio or undermine its goals.
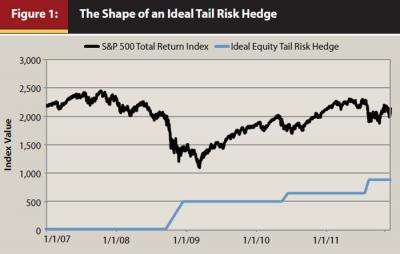
Figure 1 stylistically shows what our ideal strategy would look like—flat during normal markets (generating no cost and not interfering with the portfolio), then appreciating substantially when the market is in free fall. Lastly, it maintains its elevated level once the market has started to recover and thereafter.
Many Popular “Solutions” Fail Our Criteria
As mentioned, many solutions are available to protect client portfolios and to benefit from market declines. Some have been available for decades, and new solutions are proliferating rapidly.
The most common approach is to invest in a very conservative manner, as well as to hold a substantial amount of wealth in cash and other ultra-safe investments. Certainly, a portfolio must be appropriate to the client’s circumstances, which in some cases requires that it be exposed to no or minimal risk or have high cash holdings to cover short-term spending needs. Maintaining the appropriate level of risk and liquidity is a key risk management technique. However, excessive risk avoidance may lead to economic loss because of the decline in the client’s purchasing power over time. By being overly cautious, clients permanently give up the long-term gains of a well-diversified portfolio, impairing their ability to stay ahead of inflation—making this perhaps the costliest of strategies. Moreover, in actual practice undisciplined investors tend to move to a more conservative strategy when markets underperform and move back to a more aggressive posture when markets rebound. Over and over, these investors tend to underperform their more steadfast counterparts who stay true to their long-term strategy, whether conservative or aggressive.3
Another common technique is to purchase a put option on the portfolio’s holdings. Puts can be excellent tools to use on a tactical basis. However, as a long-term holding they violate the first two criteria (no give-back and low cost). Although they appreciate during market declines, they surrender that appreciation dollar-for-dollar when markets eventually recover. They also have a very high cost, placing a significant drag on the portfolio’s return.
One way to fully or partially offset the cost of a put is to simultaneously sell a call, in a strategy known as a collar. However, the portfolio now must give up any appreciation over a predetermined amount, thereby violating the second criterion.
An increasingly popular mode of protection is investing in gold, which tends to benefit when there is a flight to “safe” assets. Like puts, gold may be an excellent tactical investment but long term it is a cyclical, non-income-producing asset. After a market scare causes its price to skyrocket, a return to normal will cause a precipitous drop. In short, gold violates at least our first two criteria.
Another attempt at protecting a portfolio is investing in “black swan funds.” In our experience, these funds tend to have high fees, and most tend to underperform during normal market conditions (in other words, most of the time).
Some strategies are simply glorified, and often more expensive, versions of collars or other techniques described above. As new strategies become available, the financial planner must evaluate them diligently, paying close attention to fees, performance during normal markets, and counterparty risk.
A risk management technique that has had a surge in popularity is a variable annuity that provides a guaranteed minimum benefit. But the guarantee comes with a price—these annuities are costly in terms of their explicit costs and the limit that is implicitly placed on the investment growth of the policy’s cash value. Furthermore, most pay their benefits over such an extended period that the effective investment return is much lower than is apparent. Annuities also entail a loss of control over the premiums paid, which, for clients about to retire, is often a substantial portion of their portfolio. While annuities of proper size and configuration may be appropriate for certain client situations, as a tail risk hedge they violate all three of our criteria.
Volatility—Making a Friend of a Foe
Can any strategy fully meet our three criteria? Perhaps not, but a very promising set of strategies—those that allow you to “invest” in volatility—comes close.
Designing a strategy that will consistently perform well when the market swoons requires an asset that has reliably exhibited negative correlation to the market precisely during times of market stress. One “asset” that fits this description very closely is the market’s own volatility. (Note: the following discussion is confined to equity market volatility, specifically volatility in the S&P 500 Stock Index.)
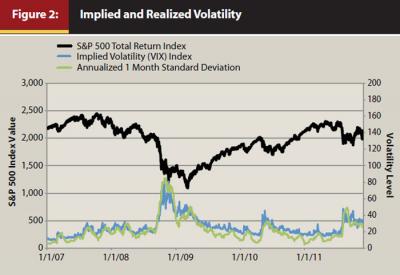
It is important to distinguish between two expressions of market volatility. One is realized volatility. This is a backward-looking measure based on historical market movements, and is usually measured by calculating the standard deviation of past market returns. The other is implied volatility, which is a forward-looking measure that captures the market’s own expectation of future volatility. This expectation is calculated from the market prices of options that are traded on the S&P 500, as those options contain an implicit estimation of future volatility.4
As shown in Figure 2, volatility—either realized or implied—is a striking mirror image of the S&P 500 Index, especially when the S&P 500 Index declines suddenly and substantially. This makes volatility an appealing candidate for a tail risk hedge.
There are ways to invest in either realized or implied volatility, or a combination of the two. In each case, a major problem to be solved is the cost. It is expensive to make a long-only, buy-and-hold investment in volatility of either sort. For implied volatility, there is an additional cost in that, given the vehicles through which you can access implied volatility, a long-term holding will inexorably lose significant value in non-catastrophic markets. In other words, these vehicles have a high cost of carry. Fortunately, there are methods to significantly mitigate these costs. The strategies to be discussed thus differ in two ways: (1) whether they employ realized or implied volatility, or both, and (2) how they mitigate the attendant cost, including the cost of carry.
Exploiting Realized Volatility
One way to invest in realized volatility is to enter into a “volatility swap.” There are many types of such swaps, but one of particular potential as a tail risk hedge has a long exposure to volatility measured on a daily basis and a short exposure to volatility measured on a weekly basis. The short position offsets the cost of the long position. Because weekly market fluctuations are usually less than the intervening daily fluctuations would imply—there are generally mid-week reversals in direction (short-term mean reversion)—this strategy tends to produce a modest positive return in normal markets. The history of the S&P 500 Index in recent decades shows that this relationship between daily and weekly volatility holds a majority (about two-thirds) of the time. Thus, by holding this swap over the long term, it should be very cost effective, even slightly profitable. (We have found that during “normal” market periods, such as 1999 through 2007, this strategy averaged a modest positive return of approximately 4 percent per annum before fees, and the prevailing fees to access the strategy are typically much less than that.)
So, while that is a nice feature, what is the virtue of this swap as a tail risk hedge? Well, it turns out that even during times of market stress markets do not usually decline incessantly, day after day. Rather, there is often a rally in the middle. The mean-reverting market behavior that generates the modest return in normal times gets amplified, and the return gets magnified, in markets under extreme stress. Does this always happen? No. Can the markets defy this tendency and have continuous daily declines that last for more than a week? Yes. But such behavior is rare. And this is what makes this strategy one to seriously consider as a tail risk hedge. However rare, though, the possible absence of mid-week mean reversion when you most need it is definitely a cause for concern, and is clearly the Achilles’ heel of this approach.
All the tail risk hedges we have encountered are vulnerable in some way. We therefore recommend using a variety of tail risk hedges to help diversify away the effects of their respective Achilles’ heels. We will return to this concept shortly.
Exploiting Implied Volatility
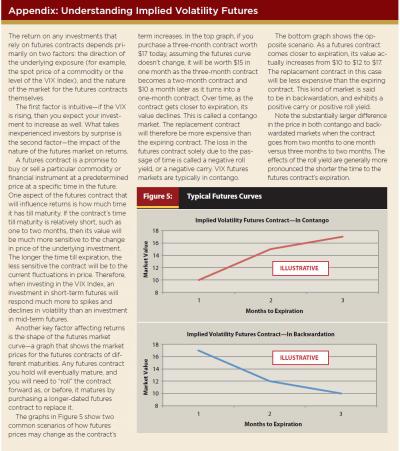
The most common way to measure implied volatility in the equity markets is through the Chicago Board Options Exchange Market Volatility Index, or the VIX (Whaley 2008). Developed by Professor Robert Whaley in 1993, the VIX represents the average implied volatility as determined by one-month call and put options on the S&P 500 Stock Index. Investing in the VIX itself is not possible; however, one can invest in futures contracts on the VIX, for which there are a number of publicly available investments. Unique aspects to investing in futures are outlined in the appendix.
The main challenge to investing in VIX futures over the long term is that during normal markets, the VIX futures market is in steep “contango” (as contracts get closer to expiration, their value declines), which results in a highly negative “roll yield” (cost of replacement contracts relative to the cost of expiring contracts), and thus a substantial cost of carry. (These terms are further described in the appendix.) An investment in short-dated VIX futures would have lost about 90 percent of its value over the period January 2009–October 2011, for example, even though during this time there were several substantial increases in the VIX itself. An investment in mid-term VIX futures would have lost 40 percent over the same period. Both investments are excellent ways to get exposure to the VIX index; however, their cumulative returns show the dangers of using them as long-term holdings.
As explained in the appendix, shorter-term futures contracts are more sensitive to changes in the spot price of the underlying investment, making them more desirable when a large increase in VIX is expected. However, they are also much more sensitive to roll yield. Because the VIX futures market is in contango during normal markets, this causes short-term futures contracts to have a significant negative roll yield most of the time.
One strategy that improves on investing in the VIX does so by dynamically allocating across several different maturities. During normal markets, when the futures market is in contango, there is a greater allocation to intermediate-term contracts to minimize negative roll yield. During stressed markets there is a greater allocation to short-term contracts to produce a higher return when volatility spikes. The result is an investment that is quicker to increase during stressed markets and slower to decrease during normal markets. However, it still decreases substantially over time—it would have lost more than 40 percent of its value if held from January 2009 through October 2011.
Another approach is to be long mid-term futures contracts and short a lesser aggregate amount of near-term futures contracts during normal markets. The near-term futures will decline more during a contango market, so shorting it will provide the investor with a positive return. The long position in mid-term futures will have a negative cost of carry, but that cost will be offset by the short position in near-term futures. As the markets become more stressed and volatility starts to climb, the allocation to the shorted position is phased out. Once the market is in backwardation (as futures contracts get closer to expiration, their value increases), the investments are fully long volatility. Our testing of this dynamic approach to long/short volatility investing over the last six years has shown it to be quite promising.
Exploiting the Spread Between Implied and Realized Volatility
A third type of strategy takes advantage of the difference, or spread, between implied and realized volatility. Institutional investment managers’ use of options to hedge against market declines increases the demand for put options during times of market stress. This relatively higher demand causes the prices of the puts to increase, resulting in increased implied volatility that is generally greater than the corresponding realized volatility. It is possible to take advantage of this spread using variance swaps. A further refinement is to systematically reverse the positions when the market is trending toward having higher realized volatility.
This kind of strategy tends to do well when volatility is at normal levels but poorly when volatility spikes, making this the opposite of what you want in a tail risk hedge. However, the potential weakness in many tail risk hedge strategies is their performance during normal markets. This strategy therefore is a potentially great diversifier to other tail risk hedging strategies.
What Else Is There?
The focus above has been on tail risk hedges that utilize market volatility. Are other approaches possible? Yes.
Another way to potentially hedge tail risk in equities—and explicitly protect against contagion among asset classes beyond equities—is to “invest in correlation.” That is, to find investments that increase in value when correlation among normally uncorrelated asset classes materially increases. There are ways to synthesize such investments from simple derivatives, but this market is not yet well developed for planners. It remains an area of further research.
Tail risk management techniques and products for financial planners still represent an emerging field, and we expect there to be many more strategies available in the next few years.
Hedge Diversification
No tail risk hedging strategy is perfect in isolation. Each has its area(s) of weakness that could result in substantial declines at inopportune times. However, because each of the strategies is constructed differently, the market conditions that highlight their strengths and weaknesses tend to occur at different times, making them good diversifiers to each other.
The top graph in Figure 3 shows the performance of three strategies: one based on realized volatility, one based on implied volatility, and one based on the spread between implied and realized volatility (which we will refer to as the “spread” strategy). The period shown was selected based on the availability of the strategies’ performance data. Note their very different performance profiles. The bottom graph in Figure 3 shows these strategies weighted 75 percent, 15 percent, and 10 percent, respectively, and the weighted combination of their performance. The implied volatility strategy received a lower allocation because of its higher volatility.

The effect of diversification can be seen both visually in the graph and numerically in how the maximum drawdown of the combined strategy is substantially lower than the maximum drawdown of any of the underlying strategies. In time, we expect more strategies to be developed that will provide additional diversification opportunities.
Two of the strategies in Figure 3 appreciated substantially during the fourth quarter of 2008, causing the combined strategy to appreciate accordingly. After 2008, the implied volatility strategy had periods of substantial decline while the other two strategies were stable/appreciating, causing the combined strategy to be fairly stable. In August 2011, the realized volatility strategy confronted its Achilles’ heel—numerous consecutive days of substantial market declines. Because the realized volatility strategy relies on mid-week mean reversion, this extended uni-directional period caused it to decline sharply. Likewise, because the spread strategy usually bets that implied volatility is greater than realized volatility, the sudden increase in realized volatility did not give the spread strategy enough time to adjust. Meanwhile, though, the implied volatility strategy enjoyed a sizable increase, causing the combined strategy to appreciate very respectably.
Note that the combined strategy increased substantially during the fourth quarter of 2008 and again in August 2011, with a modest gain in May 2010 (during the “flash crash”), and each time maintained most of the gains thereafter, thereby fulfilling our first criterion (sudden appreciation with no subsequent give-back). The following section explains how the combined strategy meets our second and third criteria. Please observe how similar the combined strategy graph in Figure 3 is to our ideal profile in Figure 1.
It’s important to note that these risk management products work in concert with—not in place of—any carefully designed asset allocation systems that have been built. To disrupt the fundamental benefits of diversification and asset allocation in pursuit of catastrophe protection would be a classic case of throwing the baby out with the bathwater.
Gaining Access to Tail Risk Hedging Strategies
The strategies shown in Figure 3 satisfy our second criterion of being low cost. They can be accessed for a reasonable fee, which may be further mitigated by the return some of them generate during normal markets. And they impose no limit on upside portfolio growth.
At the time of this writing, most sophisticated tail risk hedging strategies are difficult for the retail investor to access directly. However, at least one of the strategies is available in the form of an exchange-traded note (ETN), and there may be more to follow.
But planners can access most of these strategies on behalf of their clients now. A common way to do so is through structured notes. These are promissory notes from investment banks that can provide a highly customizable solution tailored for each planner’s needs. (An excellent description of structured notes can be found in Cordaro 2008). Essentially, a structured note is a promise from a bank to, when the note matures, return your principal plus the performance of an agreed index. The index can be virtually anything of the planner’s choosing—it could be one of the tail risk hedging strategies described in the preceding section, or some combination of them. A single master note can be allocated across all client accounts based on each client’s needs, thus giving clients of all sizes and sophistication access to an appropriate amount of the same strategy. The notes are generally priced daily, and each client’s share and market value can be reported by the planner’s custodian on client reports just as with any other holding.
A structured note can provide access to market exposure (such as the S&P 500 Index) along with exposure to the tail risk hedging strategy you seek. Each $100 invested in such a note can thus provide $100 exposure to the S&P 500 Index plus (for the same $100) $100 exposure to the desired hedging strategy. The planner should select a market exposure that would be a core part of client portfolios anyway. This is critical to fulfilling our third criterion, minimal disruption to the portfolio, because money invested in a note with an underlying investment in the equity markets, for example, is not diverted from being fully invested. For this reason, the returns of the tail risk hedging strategies are added to the S&P 500 Index returns instead of being allocated a certain percentage of the overall portfolio.
In recent years, investment banks have been reaching out to the planning community, making structured notes more accessible to planners’ clients. These notes are usually putable daily back to the issuing bank, meaning that all or a portion can be sold at any time at market value less a “haircut” that typically does not exceed 50 basis points. Investment banks realize the importance of daily liquidity and marketability to planners and their clients.
An important drawback to both ETNs and structured notes is that they expose clients to counterparty risk. Both are typically senior unsecured debt instruments and are therefore dependent on the bank’s ability to pay. Should the bank default, the clients’ entire investment in the structured note or ETN is at risk. This would add insult to injury as the bank is most likely to default during a market crisis, which is just when the investor is expecting a substantial benefit.
Dealing with counterparty risk requires performing due diligence on the issuing bank. Questions to ask include: What does the balance sheet look like? Is the bank’s business prudently diversified and not overly subject to the risks of its investment banking operations? Which entity within the bank’s organizational hierarchy is the true counterparty? What is the credit default swap (CDS) spread on the bank, meaning what is the effective “premium” being demanded by other institutions for insurance that this bank will not default? Also, it is wise to spread the risk and not have too high an exposure to any single counterparty. This would be an additional important benefit to diversifying among volatility strategies, as different strategies are offered by different banks.
It should be pointed out that planners who offer their clients access to investments through pooled vehicles, such as planner-created mutual funds, have a very powerful weapon against counterparty risk. These planners can use their pooled vehicles to enter into agreements5 with the banks to access their tail risk hedging strategies directly, and do away with the structured note “wrapper” altogether. Properly negotiated, these agreements can reduce counterparty risk to a small fraction of the level resident in a corresponding structured note.
Putting All the Pieces Together
The three investment risk management strategies documented in this and our two previous Journal articles—enhanced portfolio optimization, dynamic asset allocation, and effective tail risk hedging—should be considered integral parts of a bigger whole, working together cohesively as a “risk management team.” They can be viewed as diversification for portfolios across different market environments:
- “Normal” markets—Modern portfolio theory updated for the 21st century guides asset allocation and rebalancing to help the investor exploit the normal gyrations in the market for the portfolio’s benefit
- “Bear” markets—Momentum-based dynamic asset allocation helps alert the manager to a protracted decline in a particular asset or in the market generally, and guides the appropriate response
- “Crash” markets—Tail risk hedging strategies provide the portfolio with a safety net precisely at the time when the other risk management techniques fail
The presence of each strategy allows the other two to be opportunistically fine-tuned. For example, a momentum-based strategy may have parameters set to perform well during bear markets without demanding that it also perform well during crash markets, which might make it overly conservative.
In Figure 4, the momentum-based sector rotation strategy developed in Miccolis and Goodman (2012b) is consolidated with the combined tail risk hedging strategy displayed in Figure 3.6 The combination has an annualized return of 16 percent over this period, at a time when the S&P 500 Index was essentially flat, with a much lower standard deviation and a relatively modest 15 percent maximum drawdown. It would be natural for the reader’s initial reaction to be that this is just too good to be true. On the one hand, this is, admittedly, mostly back-tested data. Our sector rotation strategy was launched only in July 2011, and many of the tail risk hedging strategies have become available only within the past two years (our first went live in February 2010). The reader should therefore not take these historical results at face value.
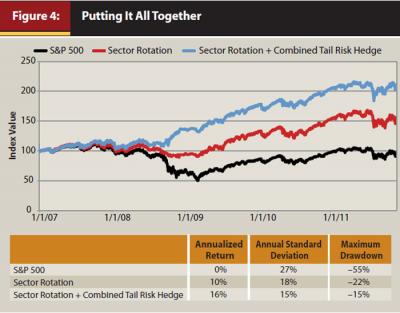
That said, this is still an intriguing picture of what is possible. Even a basic momentum-based strategy can help the investor avoid much of the damage during prolonged bear markets. Likewise, a well-diversified tail risk hedge can help during times of market crashes without being a large drag on the portfolio during other times. While we certainly can’t promise double-digit growth with modest risk, it is possible to substantially increase returns and decrease risk by astutely putting together all the pieces of the next generation of risk management.
This comprehensive approach to risk management does require that the financial planner be quite nimble across all client portfolios, especially with respect to momentum-based strategies. More nimble trading may increase transaction costs. With the addition of tail risk strategies, there may also be the need to mitigate counterparty risk.
A solution adopted by our firm directly addresses each of these issues. We created a pooled vehicle for our clients—specifically, an open-end mutual fund. This allows us, for example, to execute momentum-based sector rotation trades quickly and efficiently because we are making each trade once, not several hundred times across all client portfolios. This ensures equitable treatment among clients, and the scale of each trade allows our clients to benefit from more favorable transaction costs. Furthermore, the fund substantially minimizes counterparty risk by allowing us to replace structured notes with collateralized swap agreements with the banks, as mentioned above.
It should also be pointed out that changes of the scope we have discussed in our series of three articles require, in our view, clear and thorough client communications—for both education and documentation.7 In this regard, another change we instituted early in the process was the replacement, client by client, of our traditional investment policy statement (IPS) with an investment objective confirmation (IOC). As with most IPSs, ours not only documented the investment strategy selected by the client but also went into some detail about how that strategy would be executed, including the standard pie chart showing target asset allocations. We found this level of detail unnecessarily restrictive and a detriment to making nimble, prudent portfolio moves in accordance with a more proactive risk management approach. Our new IOCs describe, in narrative form, the selected investment strategy more fully in terms of investment objectives, income versus growth needs, and risk tolerance. There is no mention of asset allocations or pie charts; there is, instead, an agreement that the client gives the adviser full discretion to execute the client’s desired investment strategy in a prudent manner, allowing the adviser the flexibility to implement any measures deemed necessary—such as the risk management activities we have been describing.
Well Within Reach—and Important
The improvements outlined in this and our prior two Journal articles are quite achievable. Nothing has been recommended in this series that we have not already implemented or are in the process of implementing in our own mid-sized financial planning firm. Our research continues into ever better ways to solve these problems; we hope sharing our thinking engenders further industry research into these areas and additional sharing of ideas.
We were, and remain, motivated to undertake these improvements because we feel that to not make the effort to strengthen our risk management capabilities is to not have heard the wake-up call, to have learned nothing from the devastating market events of recent years, and, in fact, to have taken a step toward our own irrelevance as stewards of our clients’ financial future.
We firmly believe that state-of-the-art risk management is something our profession has a duty to deliver to our clients, and we are convinced it is best achieved through collegial efforts with our peers.
Endnotes
- The tail of a distribution is sometimes defined as the area beyond three standard deviations from the mean. Here we use it more broadly to connote a low frequency/high severity set of events, without reference to a specific probability distribution or a number of standard deviations.
- For example, in “Tail Risk Hedging: A Roadmap for Asset Owners,” Akoundi and Haugh “use the term ‘tail risk hedging’ to refer to the creation of positions within a portfolio that are created to protect against downward market moves.” We use it more narrowly to denote protection against downward market moves that are particularly unlikely, sudden, and severe.
- See, for example, DALBAR Inc.’s Quantitative Analysis of Investor Behavior report available at www.dalbar.com.
- The market price of any option can be estimated via the Black-Scholes options pricing formula. This formula is based on several parameters, most of which can be readily observed (risk-free rate of return, time to expiry, etc.). One parameter cannot be observed—the market’s expected volatility over the remaining term of the option. Implied volatility is obtained by solving the Black-Scholes formula “backwards,” using actual market price for the theoretical option price, and solving for the implied expected volatility.
- These agreements are called ISDA (International Swaps and Derivatives Association) agreements. The details of these agreements are beyond the scope of this article.
- Here the “size” of the tail risk hedge (what the investment banks call the “notional amount”) is assumed to be half the size of the sector rotation strategy.
- The multi-media approach we have taken to these communications (bulletins, briefs, audiocasts, webinars, surveys) can be reviewed on our firm’s website, as most of the material is archived there. www.brintoneaton.com.
References
Akoundi, Ken, and John Haugh. 2010. “Tail Risk Hedging: A Roadmap for Asset Owners.” Deutsche Bank Pension Strategies and Solutions (May).
Bhansali, Vineer. 2008. “Tail Risk Management.” Journal of Portfolio Management (Summer).
Bhansali, Vineer, and Joshua Davis. 2010a. “Offensive Risk Management: Can Tail Risk Hedging Be Profitable?” (February). http://ssrn.com/abstract=1573760.
Bhansali, Vineer, and Joshua Davis. 2010b. “Offensive Risk Management II: The Case for Active Tail Hedging.” Journal of Portfolio Management (Fall).
Cordaro, Christopher J. 2008. “Structured Notes: The Swiss Army Knife of Portfolio Construction.” Trends in Investing supplement to the Journal of Financial Planning (June).
Miccolis, Jerry A., and Marina Goodman. 2012a. “Next Generation Investment Risk Management: Putting the ‘Modern’ Back in Modern Portfolio Theory.” Journal of Financial Planning (January).
Miccolis, Jerry A., and Marina Goodman. 2012b. “Dynamic Asset Allocation: Using Momentum to Enhance Portfolio Risk Management.” Journal of Financial Planning (February).
Taleb, Nassim Nicholas. 2007. The Black Swan: The Impact of the Highly Improbable. New York: Random House.
Whaley, Robert E. 2008. “Understanding VIX.” Working Paper Series. http://ssrn.com/abstract=1296743.