Journal of Financial Planning: November 2013
Executive Summary
- This paper provides a framework for determining when a client should consider annuitizing some or all of their retirement assets.
- Based on the work of Pfau (2013), this study shows that clients who annuitize half of their spending needs now and delay annuitization of remaining spending needs for 20 years can obtain an efficient frontier that is nearly identical to that of annuitizing 100 percent of spending needs now.
- This paper adds to the literature by showing that clients who are unwilling to give up liquidity or invest 100 percent in equities should consider the timing of annuity products.
- As a client’s preference for liquidity increases, planners should expect fewer assets to be allocated to illiquid investments.
Sam Pittman, Ph.D., is a senior researcher at Russell Investments, where he primarily focuses on allocation solutions for retirement investors. He is engaged in the research of retirement sustainability and asset liability modeling, which supports Russell’s private client practitioner and defined contribution plan clients. Email HERE.
In the February 2013 Journal of Financial Planning, Wade Pfau published the paper, “A Broader Framework for Determining an Efficient Frontier for Retirement Income,” challenging the safe withdrawal rate approach to retirement income. He forwarded a new approach called product allocation, which was first presented by Chen and Milevsky (2003). Pfau’s article advanced the way financial planners should think about building retirement income portfolios on various fronts. Particularly, his work provides a framework for considering different types of income products and approaches, such as immediate life annuities, asset allocation, and variable annuities to build a retirement income portfolio.
Pfau (2013a) found the efficient frontier of retirement income portfolios to be composed of 100 percent stocks and an immediate life annuity. The optimal allocation to these investments depends on the retiree’s bequest motive. Retirees with higher bequest motives hold a greater proportion of stocks than annuity units. No other asset class or product makes it into the efficient mix when the objective is mixed between consumption (spending) and bequest. Not even variable annuities with a guaranteed lifetime withdrawal benefit (GLWB) rider make it into such a portfolio.
Huang, Grove, and Taylor (2012) published conclusions similar to Pfau in their Retirement Management Journal article. In their analysis, they compared portfolios composed of stocks, bonds, variable annuities with riders, and immediate life annuities, and found that immediate life annuities largely replace liquid bonds. The outcome that annuities replace bonds is not surprising. Annuities are designed to perfectly hedge one’s retirement spending liability, and they tend to have a higher yield to the retiree than a bond due to mortality credits.
An important consideration that Pfau (2013a) and Huang et al. (2012) did not analyze is the time in retirement when the annuity is purchased. It is not clear whether one should annuitize at the beginning of retirement rather than wait and annuitize later.
For several reasons, delaying an annuity purchase may increase the efficiency of a retirement income strategy, measured in terms of spending and bequest utility. First, someone who dies early in retirement prior to having purchased an annuity increases their bequest relative to someone who dies early in retirement after purchasing an annuity. Second, there is a drag associated with not being able to rebalance the portfolio when some of the products in the portfolio are illiquid (Browne, Milevsky, and Salisbury 2003). Third, the additional yield after fees of an annuity may be less than the yield or total return after fees obtained from liquid investments with comparable risk.
This paper extends Pfau’s (2013a) results by considering different timing options for the annuity purchase in retirement. Results suggest that the product strategy of annuitizing immediately and holding a portfolio of stocks, which is equivalent to Pfau’s frontier, does not produce the only efficient retirement income or product strategy. By delaying annuitization1 rather than annuitizing right away, the frontier that Pfau presented also can be obtained by delaying annuitization. Upon investigating different delay strategies, this paper discusses how preferences for liquidity and portfolio volatility can affect annuitization decisions.
Methodological Approach
As in Pfau’s (2013a) study, this research examines the efficiency of retirement income portfolios considering utility derived from spending and bequests. Like Pfau, strategies that mix an immediate life annuity and a liquid asset allocation portfolio are considered.2 However, different timing options for the purchase of the annuity are addressed: buying the annuity immediately as in Pfau, and delaying purchase for five, 10, 15, or 20 years after the initial retirement date.
One of the challenges with an analysis where annuities are potentially purchased through time is that one must be able to price the insurance products at different points in time based on prevailing market conditions. To keep the pricing of insurance products as transparent as possible, this study was premised on the simplifying assumptions described here.
Return assumptions. Return assumptions within this paper connect equity returns, bond returns, inflation, and interest rates to a consistent set of capital market assumptions. The nominal risk-free interest rate is assumed to be 2.45 percent. Inflation is assumed to be 2.1 percent. Further, interest rates are assumed to remain constant through time.
To provide a bond return assumption consistent with the interest rate assumption, it was assumed that the nominal bond return is constant too, at 2.45 percent, giving a real bond return of 0.35 percent. Like Pfau (2013a), an equity risk premium of 4.8 percent was used, making the nominal stock return expectation equal to 7.25 percent with a volatility of 20 percent. Because interest rates, inflation, and bond returns are assumed to be constant, the correlation is zero among all variables. The return of the stock portfolio is the only stochastic variable.
Pfau (2013a) used a stochastic model for stocks, bonds, and inflation. He used an equity risk premium of 4.8 percent and a volatility of 20 percent for stocks. Pfau’s inflation expectation was 2.1 percent, and the real bond return expectation is 0.3 percent. In this paper, the assumption for the expected real return of bonds differs from Pfau’s analysis. Whereas he used a real bond return of 0.3 percent, this analysis assumes a rate of 0.35 percent. The difference is based on the need to keep the return assumptions consistent with the annuity pricing assumptions discussed later and to remain consistent to the Treasury yield curve at the time the annuity is priced.
As discussed next, a single risk-free interest rate of 2.45 percent, based on the Treasury yield curve at the time the annuity was priced, is derived. In keeping the same inflation assumption as Pfau, and using the relation that the real rate is the nominal rate minus the inflation rate, this paper arrives at a real bond return of 0.35 percent.
Annuity pricing. As Pfau (2013a) also emphasized in his analysis, the intent here is to price annuities consistent with capital market assumptions and competing products.3 This study examines purchasing an annuity at different points in time, requiring annuity purchase costs to be modeled through time. Inflation-adjusted annuity prices depend on interest rates and inflation expectations at the time of the annuity purchase, and the costs that insurance companies face to hedge their risks. These costs depend on specific market conditions and available securities. Because it is not possible to know how insurance companies will price products in the future, or the costs they will face,4 it was assumed that future annuity prices will be priced the same way they are currently. Here, annuities are priced to be actuarially fair using a risk-free rate and the RP-2000 mortality tables.5 A cost to the annuity is added by decreasing the risk-free interest rate by the amount discussed in the section of the paper on fees.
Something that often is overlooked when modeling annuities is that the payments of annuities are not risk free. The default risk of an annuity will depend on the financial strength of the company backing the payments and market conditions, which also affect asset allocation portfolios. Unless the insurance company has the same financial strength as the U.S. government, the annuity payments have default risk. Given this default risk, it’s inappropriate to treat annuities as though they are risk free (see, for example, Xiong and Idzorek 2012).
Making sure the pricing of an annuity—and the riskiness of annuity payments—are correctly modeled is extremely important when making comparisons to other product types, such as asset allocation portfolios that support retirement spending. If one assumes that the asset allocation portfolio is influenced by volatile prices caused from things like financial crises, then one must assume that a risky annuity payment also can be influenced. In Pfau’s (2013a) analysis, like here, asset allocation portfolio risk is expressed using Monte Carlo simulation. But the annuity payment is not treated as risky. If the default risk of the annuity is ignored, the annuity receives an unfair advantage relative to the asset allocation.
Here, rather than model the default risk of an annuity, the annuity is priced using an assumption that the insurance company invests in risk-free Treasury securities. This makes the annuity more expensive in this analysis, thereby lowering the payment for a given level of investment; however, with this method, the payments can now actually be treated as risk free.6 This higher expense is the cost of removing the risk from the annuity payment.
Fees. To maintain consistency with Pfau (2013a), this research assumes a 20 basis point fee for both the bond investment and the stock investment. The following steps were used to assess the fee of an annuity by finding the interest rate spread used by the insurance company.
Step 1: A quote for an annuity from a company with a known credit rating was obtained from Berkshire Hathaway’s online annuity quotation system. The quote was for a 65-year-old couple residing in Washington state with 100 percent survivorship payments of $5,324 per year with $100,000 invested. Berkshire Hathaway’s financial strength is AA+. As such, an assumption was made that an annuity issued by Berkshire Hathaway also would have a credit rating of AA+.
Step 2: The single interest rate that makes the actuarial present value of $5,324 per year for life equal to $100,000 was calculated. This interest rate is 2.34 percent.
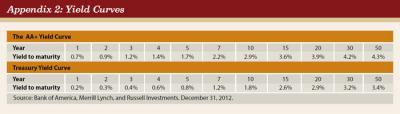
Step 3: The amount of lifetime income that is generated from $100,000 using a yield curve that approximates the AA+ yield curve (see Appendix 2) and the RP-2000 actuarial tables was estimated. The actuarially fair payment is $6,041 per year.
Step 4: The single interest rate that makes the actuarial present value of $6,041 per year for life equal to $100,000 was found. This interest rate is 3.4 percent.
Step 5: The single risk-free interest rate that makes the actuarial present value formula equal to the actuarial present value of using the Treasury yield curve (shown in Appendix 2) was calculated. This single risk-free rate is 2.45 percent, which is the single interest rate used in the analysis.
Step 6: The difference in the interest rates were assessed as follows: 3.4 percent – 2.34 percent = 1.06 percent or 106 bps as the annualized interest rate adjustment, which compensates the insurance company for managing the annuity. Rather than use the specific cost spread of 106 bps, this was lowered to 95 bps, which increases the annuity payment modestly.
Step 7: Because this paper does not consider the default risk of the annuity, the risk-free interest rate and the adjustment of the fee in step 6 was used to find the payment of the annuity.7 The interest rate used to price the riskless annuity that includes an insurance company cost is 2.45 percent – 0.95 percent = 1.5 percent.
Annuity payout rate. The computed payout rate for an annuity with a 2.1 percent cost-of-living adjustment8, for a 65-year-old couple is 3.58 percent of the initial annuity cost. This payment is lower than in Pfau’s (2013a) analysis, because this annuity is priced to be risk free. In the case of a single male investor in this analysis, the payout rate for this annuity is 4.88 percent of the initial cost. Pfau assumed that the investor was a 65-year-old couple seeking 100 percent survivorship. The payout rate for Pfau’s inflation-adjusted annuity for a couple is 3.875 percent. This payment has potential default risk.
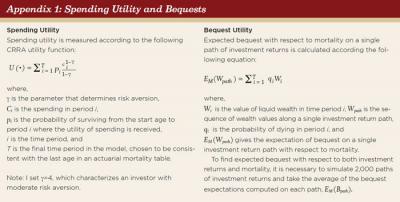
Measurement of spending satisfaction. The approach used to measure the utility of spending in this paper is different than in Pfau’s (2013a) study, but it is consistent with another presentation by Pfau (2013b), where he found consistent results. In this paper, a constant relative risk aversion (CRRA) utility function with moderate risk aversion was used.9 The utility function has the same form as the one used in Finke, Pfau, and Williams (2012) (see Appendix 1).
Bequests. Bequests, for the purposes of this research, are defined as the real value of assets at death. Bequests were measured as the expected bequest amount considering that the investor could die in any year according to the mortality table probabilities, using the RP-2000 Society of Actuary tables. (see Appendix 1).
Social Security. It was assumed that an investor would receive $2 of Social Security per year; each subsequent year the payment is inflation adjusted. Because it was assumed the investor starts with $100, the Social Security payment, as a percentage of initial wealth, is consistent with Pfau’s (2013a) Social Security amount.
Evaluation of spending strategies. To evaluate the various product strategies, investments and withdrawals were simulated using a 2,000 sample path Monte Carlo simulation. Pfau (2013a) also used Monte Carlo simulation where he employed 200 sample paths to evaluate each product allocation.
Withdrawals. This paper uses the concept of a desired spending plan, where the retiree spends a planned amount of money at the end of each year. The retiree adjusts his or her spending upward by the inflation amount each year. In carrying out a spending plan, it was assumed that spending not supported by the annuity is taken from the liquid asset allocation portfolio until wealth runs out. When wealth runs out, the retiree’s spending is supported only by any purchased annuities and Social Security. If a product strategy involves purchasing an annuity in the future, and the portfolio does not have enough wealth to purchase the desired annuity, an annuity is purchased that exhausts all liquid wealth. If there is more than enough liquid wealth to purchase the annuity, any wealth in excess of the annuity cost is left in the liquid portfolio and continues the same asset allocation strategy.
Reconstruction of the Efficient Frontier
In this section, the effects of delaying annuitization are illustrated for two different investor types: a 65-year-old couple (similar to Pfau (2013a)) and a 65-year-old male. The couple and the single male investor have just enough wealth to purchase an annuity at the start of the spending plan to cover all spending needs. An investor in this situation is 100 percent funded, because their assets equal the cost of their spending liability.
For the couple, Figure 1 illustrates a combination of product strategies that annuitize zero, all, or half of spending either immediately or after five, 10, 15, 20 years, or never. Within each strategy that does not hold a 100 percent allocation to an annuity, an asset allocation portfolio is invested in 100 percent, 80 percent, 60 percent, 40 percent, 20 percent, or 0 percent stocks and the remainder in bonds.
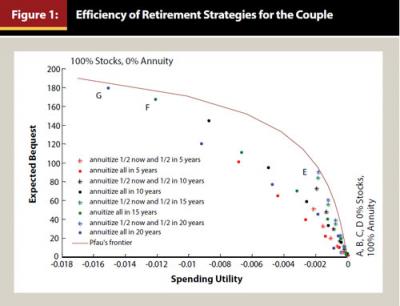
In this example, the couple starts with $100, desires a payment stream of $3.58 per year with a 2.1 percent COLA, in addition to a $2 per year Social Security benefit with a 2.1 percent COLA. Recall that $3.58 is the amount the couple can obtain from an immediate annuity. The withdrawal and initial wealth assumptions in this example are constructed so that the couple could purchase all of their desired spending today with an annuity, but if they do this, they will exhaust their wealth and bequest potential. Hence, only a couple with no bequest motive would annuitize their entire wealth.
The brown line in Figure 1 represents Pfau’s (2013a) efficient frontier. This connects points that Pfau found to be the most efficient in his study. The strategies on this frontier consist of investing a percentage of initial wealth in an annuity now and the remainder in stocks. Excluding strategies A, B, and C, strategies that delay annuitization are not as efficient as Pfau’s frontier. Even so, it is important to note that many delay strategies fall just below Pfau’s frontier.
Strategies A, B, C, and D, which implement delayed annuitization and invest liquid wealth in all bonds, are barely more efficient or as efficient as Pfau’s (2013a) frontier. This is due to the relationship between the after-fee annuity discount rate, the after-fee bond yield, and the benefit of mortality discounting. After fees, the annuity uses a discount rate of 1.5 percent, whereas the bond yield is 2.25 percent. An investor who buys an annuity essentially receives the benefit of a 1.5 percent return on the investment, plus an increment to this due to mortality discounting. At age 65, the benefit of mortality discounting is not high enough to cover the spread between the bond yield and the annuity discount rate.10 This relationship eventually changes as investors grow older and the benefit of mortality discounting increases.
Strategies D, E, F, and G are close to Pfau’s (2013a) efficient frontier. For investors with moderate to high bequest and liquidity motives, these strategies offer an alternative to Pfau’s frontier with similar efficiency. For these delay annuitization strategies, one can observe that as the bequest motive rises, delaying longer and annuitizing less spending up-front increases expected bequests, but spending utility also falls.
In addition to spending and bequest motives, many retirees express a preference for liquidity. Couples wanting liquidity can consider strategies that preserve liquidity without a large loss of efficiency. In the case of a low bequest motive, a couple could choose strategies A, B, C, or D without any loss of efficiency. A couple with a moderate liquidity need could choose one of the annuitize-half-of-spending-now strategies, which annuitizes the remainder of spending in 20 years. These strategies preserve the investors’ liquidity for 20 years without a significant drop in efficiency from Pfau’s (2013a) efficient frontier.
Figure 2 is a replication of Figure 1 except that now a 65-year-old single male investor is considered. The investor starts with $100, desires a payment stream of $4.88 per year, with a 2.1 percent COLA. Additionally, he receives $2 per year of Social Security with a 2.1 percent COLA. Similar to the couple, the male retiree is 100 percent funded.
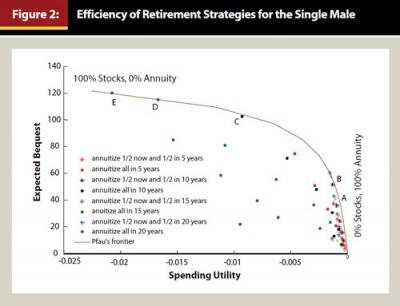
From Figure 2, it is possible to draw similar conclusions as in Figure 1, where Pfau’s (2013a) efficient frontier can be achieved by delaying annuitization. Investors who have no bequest motive or preference for liquidity should annuitize 100 percent of their assets. For investors with moderate bequest motives, annuitizing 50 percent of spending needs now, and delaying annuitization for 15 to 20 years is just as efficient as Pfau’s frontier. For higher bequest motives, annuitization can be delayed for 10 to 20 years (points C, D, and E) without efficiency loss.
In contrast to a couple, delaying annuitization for a single male achieves Pfau’s (2013a) efficient frontier in the moderate and high bequest regions. This difference in results is due to the distinct chances of dying early in retirement between a couple and a single male. Delaying annuitization increases bequest in cases when the investor, or when both members of the couple, die early in retirement. Someone who dies early in retirement and has not annuitized typically will leave a higher bequest. For a single male, the chances of dying in early retirement are much higher than the chance that both members of a couple die early in retirement. Dissimilarities in mortality expectations cause this difference in the frontier. Single males improve their bequest motive by delaying annuitization more than a couple.
One might wonder why some of the delay annuitization strategies in the high spending utility region that were efficient for the couple fall just below the efficient frontier for the single investor. As discussed previously, the benefit of mortality discounting for a couple after fees was not enough to make the annuity superior to the after-cost yield of the bond. For a 65-year-old male, the benefit of mortality discounting is high enough to make the annuity more efficient than the bond.11
This paper has attempted to extend the results of Pfau (2013a) using assumptions that are as close to his original work as feasible. Readers should, therefore, be aware that these results depend on the return assumptions as outlined earlier.
In testing different volatility levels, it was discovered that lower volatility assumptions improve the results of delaying annuitization relative to Pfau’s frontier. A volatility assumption of 15 percent moves points A through E in Figure 2 beyond Pfau’s frontier. Looking forward, financial planners can only estimate what they think volatility will be. Pfau obtained his volatility assumption of 20 percent for stocks from the history of the S&P 500 going back to 1926. Other time periods lead to different estimates. For example, the historical volatility of the S&P 500 over the most recent 10 years is 14.6 percent, and over the last 50 years it is 15.5 percent. Moreover, diversifying across other equity asset classes beyond large cap U.S. equity also will alter the volatility assumption.
Consideration of Other Preferences
The profession’s ability to measure a retiree’s preferences with a mathematical model is imperfect. Preferences other than bequest and spending utility exist and may lead one to consider strategies other than those composed of 100 percent stocks and immediate life annuities. In fact, most retirees do not invest like the annuitize-now/100 percent stocks frontier, or like the extended frontier suggests they should.
This research, similar to Pfau (2013a), was based on the assumption that investors only care about utility of spending and bequests. Many investors desire liquidity throughout retirement, not just at their death date. They also care about the volatility of their liquid portfolio. Most retirees would be unwilling to invest all of their liquid wealth in 100 percent stocks. Some of the asset allocation strategies with delayed annuitization that do not invest in 100 percent stocks may be efficient if these other objectives are considered.
Take, for example, the strategies that annuitize half of spending now and delay annuitization of remaining spending for 20 years. The efficiency of these strategies fall just below Pfau’s (2013a) frontier. However, if it is considered that many investors will not invest their liquid wealth in 100 percent stocks, and that there is a desire for liquidity, the strategies that do not use 100 percent stocks may look relatively attractive. As the preference for liquidity increases, planners should expect fewer assets to be allocated to illiquid investments.
Conclusion
An efficient frontier constructed with illiquid products should consider the timing of decisions. How products are deployed within a time-dependent strategy matters. This paper considered the simple extension of adding timing alternatives to the annuity decision to show this.
It was noted that strategies that delay annuitization, which Pfau (2013a) did not consider, are also efficient. Moreover, in Pfau’s analysis, and here as well, fixed-mixed asset allocation strategies were the only type of asset allocation strategy considered; other strategies, such as those produced by a dynamic model that consider how decisions should be made given state variables like funded status and time would produce even richer considerations that may push the frontier outward. With these considerations, a product allocation at the start of retirement should be viewed as the initial condition for a product strategy rather than a set-it-and-forget-it product allocation.
Endnotes
- Pfau (2013a) cites in his conclusion that delaying annuitization is something that should be looked at.
- Pfau (2013a) considered a variable annuity product with a guaranteed lifetime minimum withdrawal benefit. These products did not make it onto Pfau’s efficient frontier, so they are excluded here.
- Pfau (2013a) priced the annuity in his analysis according to Vernon (2012).
- Tomlinson (2012) discussed the challenge insurance companies face in hedging inflation risk.
- Source of the mortality table is the Society of Actuaries. Longevity tends to increase over time. Holding everything else equal, this will make annuities in the future more expensive than they are today.
- Although this paper priced the annuity to be risk free, it is important to note that this riskless annuity cannot be purchased; it is a modeling device to make a fair comparison between the annuity and asset allocation.
- Pfau (2013a) assumed an annual expense of 20 bps for investing in stocks and bonds. The annuity payout in Pfau’s analysis was determined from Vernon (2012), which is net of fees. The annuity he used is not free of default risk.
- Pfau (2013a) used an inflation-adjusted annuity under the assumption of stochastic inflation. This paper assumes that inflation is constant. In this paper, the pricing determined for the annuity also considered a constant cost of living adjustment rather than an annuity that is indexed to unknown cost of living adjustments.
- Pfau (2013a) used the metric of percentage of retirement spending fulfilled at the 10th percentile outcome. Using a low percentile outcome to measure spending satisfaction overstates the value of the insurance alternative. Using a low percentile outcome to evaluate spending satisfaction is similar to evaluating the benefits of flood insurance after your house floods. It would have been better to own an annuity in retirement if your portfolio runs out of money. For this reason, this paper uses a time separable CRRA utility function to measure the utility of spending, which accounts for all potential outcomes; not just the 10th percentile outcome. Like in Pfau’s approach, future utility is scaled by the probability of being alive to experience it.
- To say that the bond is more efficient than the annuity after cost means that someone could invest in the bond, then deduct the same amount as the annuity would have distributed and still have enough wealth to purchase an annuity when they are a year older. This concept is discussed in Pittman (2013).
- See Pittman (2013) for determining the hurdle rate for an annuity alternative investment.
References
Browne Sid, Moshe A. Milevsky, and Thomas S. Salisbury. 2003. “Asset Allocation and the Liquidity Premium for Illiquid Annuities.” Journal of Risk and Insurance 70 (3): 509–526.
Chen, Peng, and Moshe A. Milevsky. 2003. “Merging Asset Allocation and Longevity Insurance: An Optimal Perspective on Payout Annuities.” Journal of Financial Planning 16 (6): 52–62.
Finke, Michael, Wade D. Pfau, and Duncan Williams. 2012. “Spending Flexibility and Safe Withdrawal Rates.” Journal of Financial Planning 25 (3): 44–51.
Huang, Dylan W., Matthew M. Grove, and Todd E. Taylor. 2012. “The Efficient Income Frontier: A Product Allocation Framework for Retirement.” Retirement Management Journal 2 (1): 9–22.
Pfau, Wade D. 2013a. “A Broader Framework for Determining an Efficient Frontier.” Journal of Financial Planning 26 (2): 44–51.
Pfau, Wade D. 2013b. “An Efficient Frontier for Retirement Income.” Paper presented at the Financial Planning Association of Puget Sound 2013 Symposium: The Art and Science of Financial Planning, Seattle, Washington, February 15.
Pittman, Sam D. 2013. “When Should Retirees Commit to a Life Annuity?” Russell Investments Research Report (February).
Tomlinson, Joe. 2012. “Are Inflation-Adjusted Annuities Right for Clients? The Product and Its Prospects.” Advisor Perspectives, November 20, advisorperspectives.com/newsletters12/Are_Inflation-Adjusted_Annuities_Right_for_Clients.php.
Vernon, Steve. 2012. “Retirement Income Scorecard: Immediate Annuities.” CBS News MoneyWatch. (April 4). www.cbsnews.com/8301-505146_162-57408049/retirement-income-scorecard-immediate-annuities/.
Xiong, James X., and Thomas M. Idzorek. 2012. “Estimating Credit Risk and Illiquidity Risk in Guaranteed Investment Products.” Journal of Financial Planning 25 (7): 38–47.
Citation
Pittman, Sam. “Efficient Retirement Income Strategies and the Timing of Annuity Purchases.” Journal of Financial Planning 26 (11): 56–62.