Journal of Financial Planning; November 2014
Ekaterina E. Emm, Ph.D., is an assistant professor of finance at the Albers School of Business and Economics at Seattle University. Her research has been published in the Journal of Futures Markets, Journal of Applied Corporate Finance, and Managerial Finance.
Ruben C. Trevino, Ph.D., is an associate professor and chair of the finance department at the Albers School of Business and Economics at Seattle University. He is a former portfolio manager for Colonial Management Associates in Boston. His research has been published in The Review of Futures Markets, The Journal of Futures Market, and Journal of Financial Planning.
Executive Summary
- This paper examines the risk-return characteristics of large-growth, large-value, small-growth, and small-value stocks over the 1940 to 2012 period.
- Among large companies, value and growth investing exhibited very similar average returns and risks (as measured by standard deviation) in the more recent decades. Value has no longer beaten growth among large companies.
- Among small companies, the so-called “value premium” continues to exist. Average returns of small-value stocks continue to be higher than those of small-growth stocks in recent decades. At the same time, the risks of small-value and small-growth stocks have become practically the same in more recent decades.
- The downside risk of value stocks does not appear to be higher than that of growth stocks. Value stocks tend to hold up better than growth stocks in years of negative stock market returns.
- Taken together, these findings suggest that small-value investing still provides superior risk-adjusted returns relative to small-growth. For investors comfortable with the higher volatility of small stocks, small-value stocks may be the best choice given their superior risk-return trade-off.
Ever since the decision by Morningstar to classify domestic equity mutual funds into one of nine style categories, financial advisers have often been faced with the task of assessing the risk-return characteristics of these equity styles. The nine categories are the intersection of three size classes (large, midcap, and small), and three valuation classes (value, blend, and growth).
Investment advisers are perhaps familiar with the historic evidence that portfolios of small companies tend to have higher long-term average returns but also higher volatility than portfolios of large companies. However, the performance of so-called “value” stocks (often defined as companies with high book-to-market ratios) versus “growth” stocks (generally defined as low book-to-market ratios) is less known and more controversial. The purpose of this paper is to explore in depth the risk-return characteristics of value and growth portfolios. In particular, we focus on the possibility of average returns and risk changing over time. Thus the central questions in this study are:
- Does value investing still result in higher average returns than growth investing? Additionally, is the relative performance stable throughout time?
- Is value investing riskier than growth investing? Is the relative risk stable throughout time?
- In the event of a significant down stock market, which investment style offers the most down-side protection?
By examining the historic behavior of these investing styles, it is possible to obtain a better sense of the magnitude and stability of each style’s risk and returns. This, in turn, will help investment advisers better match the investment style to their clients.
Literature Review
The empirical literature on style investing is extensive. Most studies have found that portfolios of small companies tend to have higher long-term average returns; however, portfolios of small companies (defined as a market capitalization of $1 billion or less in recent times) also tend to have higher volatility than portfolios of large companies (defined as a market capitalization of $1 billion or more in recent times).
Similarly, most studies have found that portfolios of value stocks tend to have higher average returns than portfolios of growth stocks. However, it is not clear whether value stocks are necessarily riskier than growth stocks. For a thorough review of this literature see Chan and Lakonishok (2004). Furthermore, Fama and French (1992) sparked a controversy in the academic and professional literature when they reported that average returns are related to the size of the company and to the book-to-market ratio, but not to the beta of the company. Their findings have made the classification of portfolios by the average size of the companies inside the portfolio, and the average book-to-market of the companies held in the portfolio more important and relevant.
The literature offers two main explanations as to why value stocks generally do better over the long run than growth stocks (Chan and Lakonishok 2004). Some researchers believe that the value premium is the result of value companies being actually riskier than growth companies but that the risk is not well measured by conventional assessment tools, such as beta and standard deviation. Other researchers believe that because of investors’ behavioral patterns, they routinely overvalue growth stocks and routinely undervalue value stocks. In time, the market corrects these biases by pricing down overvalued growth stocks and pricing up undervalued value stocks. Thus, the value premium is argued to be the result of behavioral biases that investors tend to repeat.
This paper does not address these competing explanations. Instead, this paper seeks to explore in more depth the possibly changing nature throughout time of the risk-return characteristics of value versus growth portfolios. In addition, we examine how the different styles perform in the critical years when stock market returns fall.
Data and Methodology
For this study, we used portfolio returns computed by Fama and French (FF) as presented in the 2013 Ibbotson SBBI Classic Yearbook (Ibbotson 2013). FF used only two size categories: large and small. A stock was classified as “large” if its market capitalization was bigger than the median market capitalization of all the stocks on the NYSE. Otherwise, it was classified as “small.” Although only NYSE stocks were used to calculate the median size of the companies, FF also included the companies traded on the AMEX and NASDAQ. The portfolios were revised once a year.
Similarly, FF used only two valuation categories: value and growth. A company was classified as “value” if its book-to-market ratio was in the top 30 percent of book-to-market ratios of NYSE stocks. A stock was classified as “growth” if its book-to-market ratio was in the bottom 30 percent of book-to-market ratios of NYSE stocks. The 40 percent in the middle were classified as “blend.” Again, FF also include stocks traded in AMEX and NASDAQ.
Companies with negative book values were not included. Also excluded were American depository receipts (ADRs), real estate investment trusts (REITs), and unit trusts. In calculating the returns, dividends were assumed to be reinvested. Transaction costs and taxes were not included when computing returns.
In this analysis, we used total annual returns of the following four portfolios: large-growth, large-value, small-growth, and small-value. The performance of blend stocks was not included because the data was not available in Ibbotson (2013). The performance of the S&P 500 Composite Index was used as a market benchmark. Total annual returns on the S&P 500 Index were also obtained from Ibbotson. The period used in the analysis was 1940 to 2012. This period resulted in a total of 73 years of annual returns for each style portfolio. FF provided annual returns beginning in 1928. However, we excluded the initial 1928–1939 period, because we felt that the stock market behavior during the Great Depression was not representative of more modern market conditions, and that the period may have represented a statistical outlier.
Long-Term Risk-Return Characteristics
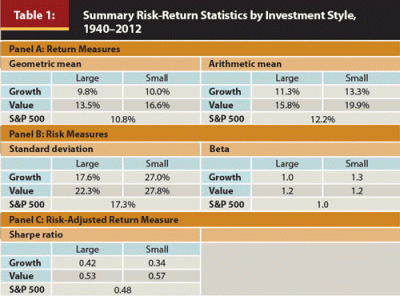
Average returns. The various measures of risk and returns for the period of 1940 to 2012 are summarized in Panel A of Table 1. Consistent with most studies, we found that large-value stocks had higher average returns than large-growth stocks. Small-value stocks also had higher average returns than small-growth stocks. The geometric mean return for large-value stocks was 13.5 percent, and 9.8 percent for large-growth stocks. Similarly, for small-value and small-growth stocks the geometric means were 16.6 percent and 10.0 percent, respectively. Therefore, value-stocks outperformed growth stocks regardless of the company size over the period of 1940 to 2012. Using arithmetic means, the results were comparatively similar. Over the whole period, the best-performing investment style was small-value.

Risk. Standard deviation of annual returns was used to measure risk. The results are shown in Panel B of Table 1. Large-value stocks had a standard deviation of 22.3 percent and large-growth stocks had a standard deviation of 17.6 percent. Therefore, over the whole period, large-value stocks were riskier than large-growth stocks. Similarly, small-value stocks had a standard deviation of 27.8 percent and small-growth stocks had a standard deviation of 27.0 percent. The difference was very small; the stocks practically had the same level of risk.
Alternatively, the beta of stocks was also used as a measure of risk. The betas were computed using the S&P 500 as a proxy for the market. Panel B of Table 1 shows that large-value stocks had a beta of 1.2, and large-growth stocks had a beta of 1.0. Similarly, small-value stocks had a beta of 1.2, and small-growth stocks had a beta of 1.3. Thus, over the entire period, large-value companies had higher betas than large-growth companies, but among small companies, small-value companies had slightly lower betas than small-growth companies.
Risk-adjusted returns. Arguably, the most widely used measure of risk-adjusted performance for well-diversified portfolios is the Sharpe ratio. The ratio is defined as the average return on a portfolio minus the average return for the risk-free rate divided by the standard deviation of annual returns. The average returns and the standard deviations are computed using annual returns for a given style over the entire period. The annual return series for Treasury bills was obtained from Ibbotson (2013). The higher the Sharpe ratio, the higher the return per unit of risk, and the better the performance is judged to be.
Panel C of Table 1 shows the Sharpe ratios for all of the four investment styles. On a risk-adjusted basis, value beat growth among both large and small companies. In particular, large-value stocks with a Sharpe ratio of 0.53 outperformed large-growth stocks, which had a Sharpe ratio of 0.42. Similarly, small-value stocks with a Sharpe ratio of 0.57 beat small-growth stocks, which had a Sharpe ratio of 0.34. Therefore, over the whole period large-value beat large-growth and small-value beat small-growth. The best performing investment style over the whole period, on a risk-adjusted basis, was small-value stocks.
Holding Periods and Relative Performance
Looking only at the average statistics for the entire period does not allow detection of the relative performance of the styles over different holding periods. In this section, we examine the relative performance of the four investment styles using one-year, five-year, and 10-year rolling holding periods. The results are presented in Table 2.

One-year holding periods. There were 73 one-year periods between 1940 and 2012. Out of these 73 periods, large-value stocks outperformed large-growth stocks in 48 of these period or 65.8 percent of the time. Similarly, among small companies, small-value beat small-growth in 48 years or 65.8 percent of the time.
Five-year holding periods. There were 69 five-year rolling periods between 1940 and 2012. Out of these 69 periods, large-value stocks beat large-growth stocks in 52 periods or 75.4 percent of the time. Similarly, small-value stocks beat small-growth stocks in 61 periods or 88.4 percent of the time.
Ten-year holding periods. There were 64 10-year rolling periods between 1940 and 2012. Of these, large-value stocks outperformed large-growth stocks in 50 of the periods or 78.1 percent of the time. Similarly, small-value stocks outperformed small-growth stocks in all 10-year periods except one—that is 98.4 percent of the time.
The results indicate that the dominance of value over growth increases as the holding period gets longer. This is especially true among small companies. Results also show that the dominance of value stocks over growth stocks is not due to a few years or a single period, but instead spreads out more over the whole 73 years included in the analysis.
The Evolving Nature of Average Returns
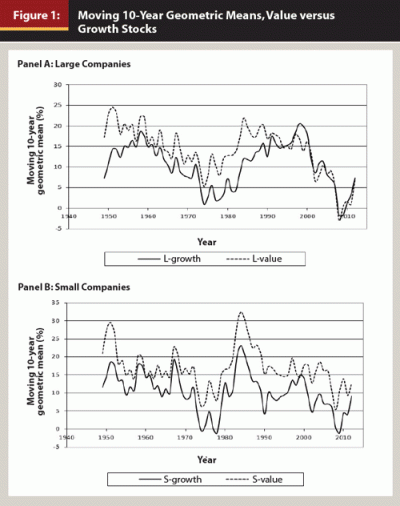
To further appreciate the relative performance of value versus growth throughout time we plotted the moving geometric mean returns for a 10-year holding period for large companies and for small companies separately. A point in the line tells us what the returns over the previous 10 years of a given portfolio have been. The results are shown in Figure 1.

Panel A of Figure 1 shows that although the large-value line was above the large-growth line for most of the period, this was not case beginning in approximately 1990. In this more recent period, (1990 returns start in 1981) the large-value line and the large-growth line seem to be closer together and cross often. This means that among large companies, value and growth portfolios have had similar 10-year holding period returns over the most recent three decades.
The case for small companies is different. Panel B of Figure 1 shows that the small-value line was almost always above the small-growth line, even in more recent years. This means that using 10-year holding periods, small-value stocks beat small-growth stocks almost all the time (98 percent of the time as indicated previously).
The Evolving Nature of Risk
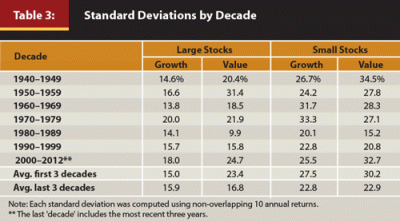
Standard deviations of annual returns for each decade were examined separately and for each of the four investment styles in order to detect possible changes in risk of different investing styles throughout time. A standard deviation for a given decade used the 10 annual returns in that decade. There were no overlapping returns. Table 3 shows the results.

Looking at the entire period, it is clear that portfolios of small companies were more volatile than portfolios of large companies. However, the relative volatility of value portfolios and growth portfolios did not stay constant. At the beginning of the period, value tended to be more volatile than growth, especially among large companies, but more recently, the volatility of value and growth portfolios has tended to converge.
To illustrate this point, we compared the average volatility of the three early decades against the volatility of the latest three decades. The results are shown in the last two rows of Table 3. For example, in the first three decades the average standard deviation for large-growth was 15.0 percent, while the large-value the average standard deviation was 23.4 percent. Similarly, in the first three decades, small-growth had an average standard deviation of 27.5 percent and small-value had an average standard deviation of 30.2 percent. In these initial decades, value was riskier than growth among both large and small companies.
However, in the last three decades of the analysis, the average standard deviation for large-growth was 15.9 percent. For large-value it was 16.8 percent, a less than 1.0 percent difference. Similarly, the average standard deviation for small-growth was 22.8 percent, and for small-value it was 22.9 percent. Thus, the risk level of value and growth appear very similar in the most recent decades.
Our conclusion is that although small stocks appear to be more volatile than large stocks, it is no longer clear that value stocks are riskier than growth stocks. In more recent decades, value and growth portfolios have had similar levels of risk among both large and small stocks.
It is interesting to point out, however, that in the last decade of the analysis (2000–2012), value stocks were more volatile than growth stocks among both large and small companies. This is because the financial crisis of 2008 affected more banks and other financial institutions, which tend to be value stocks. A similar result is apparent when the last decade is defined as 2000–2009.
Down Markets and Investment Styles
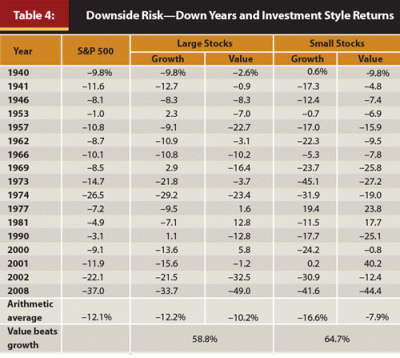
Although standard deviation estimates the volatility of stocks, it would be instructive to assess separately the down-side risk associated with different styles. To this end, we examined how different investment styles performed during years when the S&P 500 Index was down. The results are presented in Table 4.

There were 17 years with negative market returns between 1940 and 2012. On average, value stocks fared better than growth stocks during these years. Out of the 17 years with negative market returns, large-value stocks beat large-growth stocks in 10 years (58.8 percent) and small-value beat small-growth in 11 years (64.7 percent). Large-growth stocks went down on average –12.2 percent, while large-value stocks went down –10.2 percent. Among small stocks, small-growth stocks went down on average –16.6 percent, while small-value stocks went down on average –7.9 percent.
Therefore, it is reasonable to conclude from this analysis that value stocks tend to hold up better in down years than growth stocks. This is true for both large and small companies. The downside risk of value stocks is lower than that of growth stocks. From this perspective, value stocks are not necessarily riskier than growth stocks.
Having made this point, it is interesting to note that during the most significant recent market crash of 2008, value stocks did worse than growth stocks. This was true among large and small companies. We believe that this result was due to the financial crisis of 2008, which affected more banks and other financial institutions that tend to be value stocks.
Conclusion
This study takes a more dynamic approach to examining the performance of value versus growth portfolios among large and small companies. The analysis looked at how these different investment styles performed over different periods between 1940 and 2012. The underlying assumption was that risk and returns do not stay constant throughout time.
We found that the so-called “value premium” was not present among large companies over the last 30 years. In more recent years, the average returns of large-value stocks were very similar to the average returns of large-growth stocks. Furthermore, we found that over the last three decades, the risk of large-value stocks was very similar to the risk of large-growth stocks.
Among small companies, the “value premium” was present and significant. On average, small-value stocks continued to beat small-growth stocks. In fact, using rolling 10-year holding periods since 1940, small-value stocks had higher returns than small-growth stocks in 98 percent of the periods (all but one). This is impressive dominance. In addition, we noted that the risk of small-value stocks and small-growth stocks was very similar over the last three decades. Furthermore, we found that during down stock market years, value stocks tended to hold up better than growth stocks; this was true among large and small companies. In down markets, value stocks were not riskier than growth stocks.
Knowing the risk-return characteristics of investment styles is important to better match the investment style with the goals and constraints of an investor. This study reveals that the average returns and risks of the different investment styles have changed throughout time. Among large companies, the choice between value and growth stocks seems to no longer be as material because both styles have practically the same returns and risks. However, among small companies, value stocks have continued to generate superior returns without incurring significantly higher risk. For those investors willing to tolerate the higher volatility associated with small stocks, small-value stocks may be the better choice over small-growth stocks given their superior risk-return trade-off.
References
Chan, Louis, and Josef Lakonishok. 2004. “Value and Growth Investing: Review and Update.” Financial Analysts Journal 60 (1): 71–86.
Fama, Eugene F., and Kenneth R. French. 1992. “The Cross Section of Expected Stock Returns.” Journal of Finance 47 (2): 427–465.
Ibbotson. 2013. 2013 Classic Yearbook: Market Results for Stocks, Bonds, Bills, and Inflation, 1926–2010. Chicago: Ibbotson.
Citation
Emm, Ekaterina, and Ruben Trevino. 2014. “The Changing Risk-Return Characteristics of Value and Growth Investing.” Journal of Financial Planning 27: (11) 55–60.