Journal of Financial Planning: August 2024
August Saibeni began his professional career at one of the Big Eight CPA firms, with emphasis on healthcare clients. He then worked for publicly traded healthcare companies in the Los Angeles area prior to becoming corporate controller for a major Sacramento healthcare system. He then became president and CEO of a surgery center spin-off, which was subsequently sold to a publicly traded healthcare company. After retiring as president and CEO, he served as an adjunct accounting professor for 16 years at a local community college. August has had several articles published in other journals.
JOIN THE DISCUSSION: Discuss this article with fellow FPA Members through FPA's Knowledge Circles.
FEEDBACK: If you have any questions or comments on this article, please contact the editor HERE.
Given the significance of interest rates for investors, it may be of interest for investors to consider four useful methods of calculating or estimating the current “run rate” of inflation measured at an annual rate. The media generally reports year-over-year inflation; however, this is a historical measure dependent upon the previous year’s level of inflation. Most investors are interested in an estimate of where inflation will be in the future, not necessarily what the current inflation measure is based upon prior year’s data. To analyze the run rate of inflation, this article uses both the Consumer Price Index (CPI) and the Personal Consumption Expenditures Index (PCE). Each index is a bit different, as summarized by the Federal Reserve Bank of Cleveland: “The CPI is based on a survey of what households are buying; the PCE is based on surveys of what businesses are selling” (Haubrich and Millington 2014). The Federal Open Market Committee (FOMC) favors the PCE inflation measure, as has been reported by the FOMC, however, the public may be most cognizant of the CPI.
In this article, I estimate the current run rate of inflation using four methods: (1) a year-over-year percentage, (2) an annualized percentage, (3) a six-month average of annualized data, and (4) a weighted average method, referred to as the “instantaneous” method (Eeckhout 2023).
The year-over-year calculation, often reported by the media, is simple and results from dividing the current month by the same month from the prior year, subtracting one, and multiplying by 100. To compute the compound annualized change, the second method annualizes the current month by the following steps: Divide the current month’s inflation index by the prior month, raise the result to the 12th power, subtract one, and multiply by 100. Although CPI data are generated by the Bureau of Labor Statistics and PCE data are generated by the Bureau of Economic Analysis, data for the following example can be conveniently retrieved from the Federal Reserve Bank of Saint Louis. For example, we use the Consumer Price Index for All Urban Consumers, Federal Reserve Bank of Saint Louis (FRED) data series, CPIAUCSL. If a prior month’s inflation index, say for February 2024, was 311.054 and the March 2024 index was 312.230, we make the following calculation: 312.230 / 311.054 = 1.003781. We then raise the result to the 12th power, 1.00378112 = 1.046, subtract one, and multiply by 100 to annualize the month of March’s inflation rate, which in our case equals 4.6 percent. The problem with using the annualized current month calculation to forecast the run rate of inflation is that it may be volatile and over- or understate what the current inflation run rate is. We can illustrate the volatility by comparing the annualized rate for March 2024 to April, which was 3.8 percent, and May, which shows an annualized rate of 0.1 percent.
The third method helps to smooth volatility by averaging the prior six months of annualized data. This method was used several decades ago (Sprinkel 1971). During the 1980s, Dr. Sprinkel was the 14th chair of the Council of Economic Advisors. At the time of Beryl Sprinkel’s recommendation, personal computers were not available, and the six-month averaging method was easily calculated without a computer.
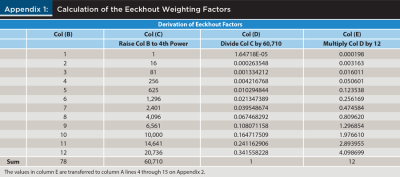
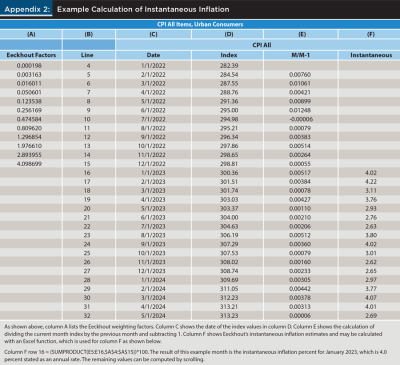
The fourth method, using Eeckhout’s weighted average calculation, weighs the most recent data more heavily than past data. Eeckhout’s weighted average method is somewhat similar to the rule of 78 loan interest recognition, however, he raises the monthly factors to the fourth power to calculate how the previous months’ data will decay by applying his weighting factors. The weighting factors count the most recent month more heavily than the prior month, using a 12-month weighting regime. The rule of 78 loan interest recognition weighs the first weighting factor most heavily to compute interest recognition. Appendix 1 shows how to calculate the Eeckhout weighting factors, and Appendix 2 shows how to calculate instantaneous inflation estimates.
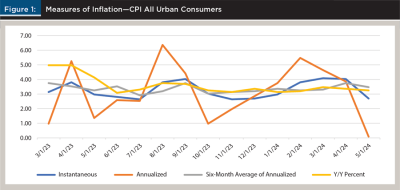
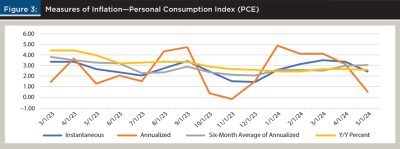
Figures 1 through 4 illustrate the instantaneous, annualized, six-month average of annualized, and year-over-year percentages. Using the Eeckhout weighted average method, which he calls “instantaneous” inflation, I show that the current CPI estimate of inflation stated as an annual rate as of May 2024 is 2.7 percent. The annualized method shows 0.1 percent. The six-month average of the annualized data is 3.4 percent, and the year-over-year rate is 3.3 percent. Notice that the year-over-year historical computation currently shows a higher inflation rate compared to the instantaneous calculation. This is a reversal from the prior month’s comparison, resulting from the 0.0 percent increase in CPI inflation for May 2024. Looking at Figure 1, as of about November 2023 or December 2023, the instantaneous calculation may have hinted at an inflection in the CPI percent change curve, which could be in the process of reversing. A caution is that CPI for all items has benefited from low to negative inflation for food and energy over the past few months, which are volatile. This volatility is why the FOMC and economists look closely at CPI excluding food and energy, known as Core CPI. Basing our judgment solely on the rate of inflation using CPI for all items can give a false sense of the run rate for general inflation due to the previously mentioned volatility of food and energy inflation.
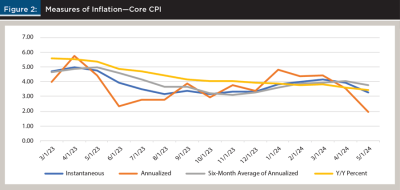
Similar calculations may be made for Core CPI. Using the instantaneous method, the inflation estimate for Core CPI as of May 2024 is 3.3 percent, compound annualized inflation is 2.0 percent, the six-month average of the annualized data is 3.7 percent, and the Y/Y 3.4 percent. Note again that the year-over-year calculation shows a higher inflation rate compared to the instantaneous calculation. This comparison is also a reversal from the prior month. The instantaneous rate of 3.3 percent and the six-month average rate of 3.7 percent continue to show that it could still be too early to drop interest rates.
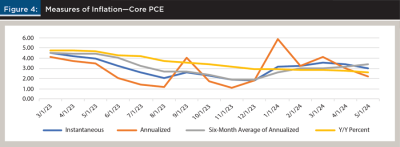
As mentioned, the FOMC closely watches both the Personal Consumption Expenditures Index (PCE) and Core PCE inflation to decide upon the proper level of the federal funds rate. For PCE inflation, the year-over-year calculation of 2.6 percent shows a higher inflation rate compared to the instantaneous calculation of 2.4 percent, which is a reversal from the prior month. If one assumes that the weighted average method and the instantaneous method more closely estimate the current PCE inflation run rate compared to the year-over-year method, the instantaneous rate seems to be approaching the FOMC stated goal of 2 percent inflation, however, it may still be too early to dictate a reduction in the federal funds rate, given the six-month average of the annualized inflation rate of 3.1 percent. The Core PCE run rate seems also to agree that more time is needed to tame inflation. The instantaneous annual rate is at 3.0 percent and the six-month annualized rate is at 3.4 percent based upon my forecast of May’s PCE inflation, which was not available as of press time.
Conclusion
The FOMC has stated that it would like to see the PCE inflation rate close to 2 percent measured as an annual rate, so it is useful for individuals, investors, and businesses to have some sense of the run rate of inflation in order to improve decision making. I contend that the methods presented here help to make a reasonable judgment about the run rate of inflation.
By focusing on the instantaneous method and the six-month average of annualized data, I conclude, contrary to the popular view, that the FOMC would not drop rates as quickly as seems to be expected by many investors. Of course, my opinion could change as data unfolds, including change in real GDP, new claims for unemployment, and the unemployment rate, all complicating factors beyond the scope of this article.
References
Eeckhout, Jan. 2023, August 28. “Instantaneous Inflation.” SSRN. https://papers.ssrn.com/sol3/papers.cfm?abstract_id=4554153.
Haubrich, Joseph G., and Sara E. Millington. 2014, April 17. “PCE and CPI Inflation: What’s the Difference?” Economic Trends. www.clevelandfed.org/publications/economic-trends/2014/et-20140417-pce-and-cpi-inflation-difference.
Sprinkel, Beryl. 1971. Money & Markets: A Monetarist View. Richard D. Irwin, Inc.