Journal of Financial Planning: June 2024
NOTE: Please be aware that the audio version, created with Amazon Polly, may contain mispronunciations.
John Paglia, Ph.D., CPA, CFA, is a professor of finance at the Pepperdine Graziadio Business School where he teaches graduate-level classes on the topics of corporate finance, business valuation, and mergers and acquisitions. He is the recipient of several prestigious awards for his contributions to the business valuation profession and work on the financing and capital markets.
JOIN THE DISCUSSION: Discuss this article with fellow FPA Members through FPA's Knowledge Circles.
FEEDBACK: If you have any questions or comments on this article, please contact the editor HERE.
NOTE: Click on the images below for PDF versions.
Traditional diversification strategies have largely set an overall target mix between stocks and bonds at 60 percent equities and 40 percent debt as the base case asset allocation. Execution of this general split has largely been activated in the public equity and debt markets. However, given the recent growth of, and access to, private capital and private debt markets, the time has come to include such private investments in the asset allocation mix for return and diversification benefits.
Recent years have proved to be quite challenging for traditional investors. The year 2022 in particular was especially problematic for investors who watched their stock and bond portfolios decline in value due to influences of inflation, interest rates, and other economic headwinds. This period was unique in that both public stock and bond values declined simultaneously. At one point during the year, the Nasdaq had declined over 30 percent while the S&P 500 was down over 20 percent; and in the first quarter of 2022, the Bloomberg U.S. Aggregate Bond Index lost nearly 6 percent of its value alone. The investment landscape shifted with both asset classes’ values declining simultaneously. For all of 2022, annual returns for bonds were –7.63 percent while returns for stocks were –19.44 percent. FS Investments reported that the three-year rolling correlation for the 2021–2023 period between the S&P 500 and the Bloomberg U.S. Aggregate Bond Index reached a 40-year high at 0.68.1 Reported annual returns for both of these assets are listed in Table 1 below.

Investors have become increasingly confused given the low historical correlations between stocks and bonds and are now curious if the traditionally prescribed base case of 60 percent public equities and 40 percent public debt mix is due for a recalibration.
History of the Traditional 60/40 Asset Allocation
Modern portfolio theory (MPT), the fundamental driver for investment portfolio diversification, was introduced by Professor Harry Markowitz in 1952. In his scholarly work, Dr. Markowitz asserted that a strategically crafted portfolio exhibited diversification benefits given that overall portfolio risk was less volatile than the summed linear combination of the individual assets’ standard deviations.2 Alternatively, although individual assets in a portfolio could be fairly risky in isolation, when combined, the overall portfolio’s risk could be low. A significant influential factor of the portfolio diversification benefit is the degree of correlation, or the tendency of asset returns to move together (or apart) through time. A diversification benefit generally occurs when one holds multiple assets in the same asset class (e.g., multiple company stocks, preferably in different industries or sectors) or even assets of different classes (e.g., stocks and bonds). Generally speaking, the diversification benefit is more valuable with more assets and classes of assets combined.
There are two driving assumptions of MPT that continue to be relevant today:
- Investors, for each amount of expected return, seek to minimize risk (the corollary is that investors seek to maximize returns for a given level of risk); and
- Risk can be reduced by adding assets that aren’t perfectly correlated to a portfolio, meaning their returns don’t track perfectly through time.
Generally, investors will achieve more diversification benefits by combining various assets with unique exposures (value stocks, growth stocks, different industries, geographic diversity, multiple asset classes, etc.).
One key element of MPT is to recognize that not all risk is diversifiable. Virtually all assets will have sensitivities to major macroeconomic shocks (e.g., GDP growth, interest rates, inflation, oil price shocks) and will react in the same direction but with varying magnitudes. These risks are known as undiversifiable, systematic, or market risks. Other risks, known as unsystematic risks or diversifiable risks (e.g., a missed EPS number, weakened customer demand for a specific product or service, CEO change), may pertain to only one asset (or perhaps even a small group of assets) in a well-diversified portfolio. Therefore, the impact of an adverse event is significantly tamed by the performance of other assets in the portfolio that aren’t reacting similarly. For this reason, investors largely find comfort by investing in index funds (such as the S&P 500) as they then hold many assets representing a broad market segment.
Back in 1952 when MPT was introduced, portfolio managers began to create diversified portfolios; they assembled a general basket of publicly traded stocks and bonds. Many financial planners and wealth advisers subscribed to the 60/40 diversification approach, where a target portfolio allocation of 60 percent went to stock and 40 percent went to bonds. However, with the rise of various private investments assets in recent years, and increasing access to the same, it questions whether the historical 60/40 target allocation is optimal today. Rational investors seeking maximized returns for a given level of risk, or greater returns for a commensurate minimum portfolio risk, should seriously consider adding private investments to their portfolios and abandoning the traditional 60/40 split.
Institutional Investors Have Blazed a Trail
Over the past few decades, institutional investors have experimented with adding alternative investments into their portfolios and have found success on both the risk and return dimensions. Their successes have been well documented. Accordingly, institutional investors have developed an increased appetite for private (or alternative) investments.
In recent months, a variety of institutional investors have announced their intent to include more alternative assets in their portfolios. On March 19, 2024, it was reported that the largest U.S.-based pension fund, estimated at $490 billion, California Public Employees’ Retirement System (Calpers), approved an increased exposure to private equity and private credit investments. Calpers is increasing its private equity and private credit target from 13 percent to 17 percent while reducing its allocation to publicly traded stocks and bonds.3 On July 26, 2022, it was reported the $2.1 billion Oregon Common School Fund revised their target allocation to 15 percent in private equity investments.4 On May 18, 2022, AustralianSuper, Australia’s biggest superannuation fund, announced its plans to grow its private equity portfolio from $9 billion to $18 billion by 2024, and to $50 billion by 2028.5 Ventura County, California, also announced its intent to increase allocations to private equity and private debt as part of its portfolio risk and return strategy.6 By 2026, the Ventura County Employees’ Retirement Association is targeting within its alternative asset segment: 20 percent to venture capital and growth equity, 35 percent to North American buyouts and special situations, 15 percent to international buyouts and special situations, and 30 percent to co-investments and secondaries. These are just a few recent examples of the general shift to private investments among institutional investors. Naturally, given the shifting target asset allocations by institutional investors, one wonders if individual investors should optimize their portfolios as well.
General guidance has also begun to surface on target portfolio allocations that include private alternative assets. An Investment Executive article on May 10, 2022, advocates for a revamping of the traditional 60/40 portfolio, suggesting public stock / public bonds / alternatives in the ratios of 50/30/20 or 40/30/30.7Forbes published an article in January 2020 that recommended putting 15–30 percent of a portfolio in alternative assets as part of a prudent and diversified investment strategy.8 Furthermore, nonprofit advocacy organizations such as the Defined Contribution Alternatives Association (DCALTA) are surfacing to advance the utilization of alternative investments within a defined contribution framework.9
These individual announcements align with several recent reports and surveys. In BlackRock’s 2023 Global Private Markets Survey of over 200 institutions comprising $15 trillion in AUM, the average portfolio allocation to private markets was 24 percent.10 The top factors cited for such significant allocations was income generation (82 percent) followed by capital appreciation (58 percent). With respect to risk, 42 percent indicated diversification as one of the most important factors driving private market investments. In the report, Edwin Conway, global head of BlackRock Alternatives, shares, “Sophisticated investors have long abandoned the 60/40 asset allocation model.” Another recent report, Top Trends in Asset Management for 2024, published by Coalition Greenwich, shared relevant data. According to their survey, which polled 247 institutional investors around the world, 40 percent plan to increase their allocations to private debt over the next three years while 36 percent plan to increase allocations to private equity, 29 percent plan to increase investment in private infrastructure equity, and 23 percent plan to increase deployments toward venture capital.11 A summary of their findings is outlined in Table 2.

The trends highlighted in the institutional investor arena have caught the attention of regulators who have relaxed their stance with respect to individual investors potentially investing in private market instruments. On this note, the U.S. Department of Labor issued an information letter in 2020 followed by a supplemental statement in December 2021 that suggests private equity investing in retirement accounts, such as in 401(k) and 403(b) plans, may now be prudent.12 This letter opens a path for plan administrators to include private equity as long as such plans provide benefit to participants and beneficiaries.
Implications for Individual Investors
Given that regulatory authorities are now amenable to including private investments in retirement portfolios and with institutional investors tipping their hands toward increased private investment allocations, what should individual investors and their financial advisers do? At a high level, investors need to understand the risks and returns associated with private investments and how they might impact the same as part of a diversified portfolio.
Private Capital Types
The classes and types of private capital have grown considerably over the years and can be organized in a number of ways. At a high level, private investments are collections of investment assets that don’t trade in the public markets. Most often, these investments are managed in a fund through active and professional management. Ownership interests in the funds are relatively illiquid and frequently are subject to lengthy holding periods between 10 and 12 years, though sometimes longer. Bain & Company, as part of its Global Private Equity Report 2024, estimates worldwide private capital AUM at $14.5 trillion, increasing from $4.0 trillion just 10 years earlier in 2013.13 This growth represents a CAGR of 14 percent over the 10-year horizon. Preqin estimates the size of some of the key market segments in its Preqin Investor Outlook: Alternative Assets H1 2022 report, as follows:14
- Private equity at $5.3 trillion
- Venture capital at $1.7 trillion
- Hedge funds at $4.3 trillion
- Private debt (distressed) at $262 billion
Returns of Various Private Investments Classes
One of the benefits of alternative assets is that they tend to provide greater returns than traditional public market investments, especially over longer investment horizons. According to a report by Cambridge Associates, Private Investing for Private Investors: Life Can Be Better After 40(%), where they examined data on institutional investor allocations and returns over the 1998–2018 period, institutions that allocated more of their portfolios toward private investments had higher average annual returns.15 The average return for institutional investors with less than a 5 percent allocation to private investments was 6.4 percent, while those with allocations greater than 15 percent returned 8.2 percent annually on average.
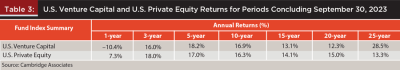
Of course, understanding the drivers of those incremental benefits by asset class is important. Cambridge Associates publishes a series of reports on returns for U.S. private equity and U.S. venture capital for various time horizons spanning from a quarter to 25 years.
According to the Cambridge Associates U.S. private equity benchmarks as of September 30, 2023, across the longest 25-year time horizon, U.S. private equity returned in aggregate a 13.3 percent average annual return compared to the Russell 2000 public market equivalent (PME) of 8.0 percent and the Russell 2000 PME of 8.5 percent.16 For U.S. venture capital, again across the longest 25-year time horizon, average annual returns were 28.5 percent, compared to the Nasdaq PME of 10.5 percent and Russell 2000 PME of 8.1 percent.17 It is worth noting that the public market equivalent (PME) maps cash inflows and outflows from private equity and venture capital uniquely and proportionately to the public markets to create a more consistent comparison. Table 3 summarizes U.S. private equity and U.S. venture capital returns for various time horizons preceding September 30, 2023.
One question arises regarding wealth creation differentials over a relatively long time horizon: What are the incremental returns to private equity over public market equity that one could expect for the liquidity risk and other risks inherent in private equity investing?
In a blog post on the CAIA website, Steve Nesbitt from Cliffwater calculates the wealth differential from investing in public stock versus private equity for state pensions for the 21-year period ending June 30, 2021.18 He concludes that private equity annualized returns, net of fees, were 11 percent, as compared to the 6.9 percent annualized return that otherwise would have been returned by investing in public stocks.
Over the 21-year time horizon, if one were to have invested $1 in each, the private equity portfolio would have yielded a value of approximately $9 versus the public market portfolio, which would have yielded approximately $4. This study highlights the power of compounding returns and reveals that investing in private equity over these 21 years resulted in over two times the wealth creation that would have been created by investing in public stocks.
Private Investment Risks
There are some risks associated with investing in alternative assets. One risk that is frequently cited is capital lockup or liquidity risk, meaning that if an investor wishes to exit a fund position on short notice, it may not be possible; or if it is possible, it may be at a significant discount to the fair value of the portfolio assets. Illiquidity or capital lockup was the most significant barrier, cited by 49 percent of respondents, facing institutional investors in the BlackRock survey.19 Many private equity and venture capital funds will lock up investments for multiple years across the 10–12-year fund life, and some can run upwards to 15 years with extensions. This can be especially challenging for investors with pressing liquidity needs, so proper financial planning with their wealth manager is recommended before fixing a target allocation to private investments.
Other risks of investing in alternative assets include valuation risk, market or economic risk, funding (timeline) risk, operating risk, and fund manager risk to name a few. Regarding fund performance, just as there are managers that do exceptionally well, there are also managers that underperform targeted benchmarks. Those underperformances (divergences) may be more significant than with public market investing. Compared to a mutual fund, where a fund manager may have more than 50 positions in their portfolio, it isn’t uncommon for a private equity fund to have fewer than 25 portfolio companies in a fund. That said, sometimes all it takes is one or two business failures in a portfolio to affect overall fund returns significantly. One should understand that these risks are real.
Another fundamental risk with private investments pertains to the operations of the fund itself. The fund may not perform at its potential due to having a change of leadership, weak team, insufficient processes and support systems, inadequate resources, and so forth.
Recognizing the numerous risks and limitations, individuals investing in private investments must adhere to a well-defined strategy that fits their goals and objectives, and also includes a well-diversified portfolio that incorporates risk preferences, funding timelines, and liquidity considerations.
Portfolio Diversification with Alternative Assets
When added to traditional individual investment portfolios, alternative assets have created significant diversification benefits. Several surveys and studies have supported an enhanced diversification benefit associated with adding private investments.
One such study was produced by Cambridge Associates and found that institutions that invested more (>15 percent) toward private equity experienced less downside risk, in terms of portfolio returns, during soft market years as compared to portfolios with smaller allocations.20 Some of this difference may be attributed to private equity funds holding assets for longer durations on average and not panic selling based on the collective emotional state of the markets. Nonetheless, it suggests that holding a larger allocation of private investments may be beneficial toward dampening overall portfolio risk.
Another study by Cambridge Associates reveals that institutional investors who are more heavily invested in private investments exhibit lower portfolio volatility as measured by two common risk measures, standard deviation and the Sharpe Ratio, while also delivering higher returns.21 Comparing those asset managers holding 30 percent or more in private investments to those with less than 10 percent, annual average returns are 2.1 percent higher (8.7 percent versus 6.6 percent), portfolio standard deviation is lower (7.4 percent versus 10.5 percent), and the Sharpe Ratio, which standardizes return per unit of standard deviation, is higher (1.12 versus 0.78). This study suggests there are significant risk and return benefits from adding private investments to a portfolio.
These data support the assertion that private investments can boost returns while reducing portfolio risk.
Portfolio Private Investments Allocations
Now that we’ve established that private investments can increase portfolio returns and provide portfolio diversification benefits, the next question is: What should be a benchmark target asset allocation for individual investors? The traditionally used 60/40 target is no longer relevant, given the proliferation of various private investment strategies now available.
One piece of work that may shed some directional insight comes from Cambridge Associates. In their report, they examined top-performing institutional investors (top decile of returns) from 1993–2018 to understand current asset allocations and how they have changed over time. They found that those top performers increased their weights toward private investment allocations.22 Those with the highest returns over the 25-year period reported allocations to private investments of approximately 40 percent of their portfolios.
Considering that institutional investors are now holding and targeting significant amounts of private investments in their portfolios, what should individual investors target to achieve higher returns and diversification benefits? Unfortunately, there is no one-size-fits-all model for target asset allocations, so individual investor preferences, liquidity constraints, cash flow timing, time horizon, risk preferences, etc., all need to be considered with the support of a financial adviser. One thing is clear however: The traditional public stock and public debt baseline allocation of 60/40 is no longer.
Individual investors, especially with longer investment time horizons and higher risk tolerances, may find as a base case that significant allocations to private investments are prudent in context of their portfolios. Some may find that mimicking institutional investors’ alternative asset allocations of up to 40 percent may be reasonable; for others, a smaller allocation of 5–10 percent may be wise. However, as an initial foray into private investments, individual investors would be wise to consider allocating at least 10 percent to private investments in the context of a well-diversified portfolio, and possibly more. Having such an allocation to private assets may help investors achieve their financial goals over the long term.
Conclusion
The fairly recent downturn in the public markets, where both stocks and bonds declined in value simultaneously, has highlighted the need to further manage risk through asset diversification. Most individual investors have been excluded from participating in private investments due to regulatory and access constraints, but those restrictions are now easing to allow individual investor participation.
The traditional 60/40 model, put into place several decades ago, as the baseline target asset allocation mix is no longer relevant for individual or institutional investors. Institutional investors abandoned this target many years ago in favor of including significant amounts of private investments. Top return performers in this space have recognized that private investments can offer superior returns to what traditionally was provided by a 60/40 mix of public company stocks and bonds. These investors have realized a sizable diversification benefit as well.
Given the proliferation of and increasing access to private investments, each with its own risk and return profiles, individual investors may find value in joining their institutional counterparts by allocating part of their portfolios to the private investments category. Although individual optimal allocations will depend on unique facts and circumstances and should be arrived at in consultation with qualified financial advisers, it is now time to target a new minimum baseline asset allocation case of at least 10 percent to private investments.
Endnotes
- See https://fsinvestments.com/fs-insights/chart-of-the-week-2024-1-5-stock-bond-correlation/. Accessed March 18, 2024.
- Markowitz, Harry. 1952. “Portfolio Selection.” Journal of Finance 7 (1): 77–91.
- See www.privateequitywire.co.uk/calpers-to-up-pe-and-private-credit-bets-by-34bn-in-pivot-from-stocks/#:~:text=The%20board%20of%20the%20California,to%20a%20report%20by%20Bloomberg. Accessed April 9, 2024.
- See www.venturecapitaljournal.com/oregon-to-hike-pe-target-in-school-fund-to-boost-performance/. Accessed March 18, 2024.
- See www.venturecapitaljournal.com/australiansuper-will-double-down-on-pe/?utm_source=newsletter-daily&utm_medium=email&utm_campaign=vc%e2%80%a6. Accessed March 18, 2024.
- See www.venturecapitaljournal.com/active-vc-investor-ventura-county-boosts-pe-exposure/?utm_source=newsletter-daily&utm_medium=email&utm_campaign=vcj-daily-bronze&utm_content=25-04-2%e2%80%a6. Accessed March 18, 2024.
- See www.investmentexecutive.com/news/products/wanted-a-substitute-for-the-60-40-portfolio/. Accessed March 18, 2024.
- See www.forbes.com/sites/theyec/2020/01/31/how-alternative-investing-can-improve-your-portfolio/?sh=b5a716254aa5. Accessed March 18, 2024.
- See www.dcalta.org/. Accessed March 18, 2024.
- See www.blackrock.com/institutions/en-zz/literature/whitepaper/global-private-markets-survey.pdf. Accessed April 9, 2024.
- See www.greenwich.com/asset-management/top-trends-asset-management-2024. Accessed April 9, 2024.
- See www.dol.gov/agencies/ebsa/about-ebsa/our-activities/resource-center/information-letters/06-03-2020-supplemental-statement. Accessed April 9, 2024.
- See www.bain.com/globalassets/noindex/2024/bain_report_global-private-equity-report-2024.pdf. Accessed April 9, 2024.
- See Preqin Investor Outlook: Alternative Assets H1 2022.
- See www.cambridgeassociates.com/insight/private-investing-for-private-investors-life-can-be-better-after-40/. Accessed April 9, 2024.
- See www.cambridgeassociates.com/wp-content/uploads/2024/02/WEB-2023-Q3-USPE-Benchmark-Book-1.pdf. Accessed April 9, 2024.
- See www.cambridgeassociates.com/wp-content/uploads/2024/02/WEB-2023-Q3-USVC-Benchmark-Book.pdf. Accessed April 9, 2024.
- See https://caia.org/blog/2022/07/20/long-term-private-equity-performance-2000-2021. Accessed April 9, 2024.
- See www.blackrock.com/institutions/en-zz/literature/whitepaper/global-private-markets-survey.pdf. Accessed April 9, 2024.
- See www.cambridgeassociates.com/insight/private-investing-for-private-investors-life-can-be-better-after-40/. Accessed April 9, 2024.
- See www.cambridgeassociates.com/insight/building-winning-portfolios-through-private-investments/. Accessed April 9, 2024.
- See www.cambridgeassociates.com/insight/private-investing-for-private-investors-life-can-be-better-after-40/. Accessed April 9, 2024.