Journal of Financial Planning: March 2013
Executive Summary
- The last few years have seen dramatic shifts in investment flows from equity into fixed income, with fixed income viewed as a safe bet. Paradoxically, as a result of this reallocation, fixed income has become a major source of return and risk, as investors have moved into higher risk interest rate assets.
- To earn higher yields, fixed income investors have had to choose longer maturity bonds with higher interest rate sensitivity (duration risk), or lower credit quality bonds with higher default probabilities (credit risk), or both. As the demand for long-term government and high-quality corporate bonds has pushed yields down, investors have piled into lower-quality municipal bonds, high-yield corporates, and emerging market bonds.
- Callable bonds offer another opportunity to earn compensation for risk. These investments combine a bullet (regular non-call) bond with a short option, which affords the issuer an opportunity to call/buy back the bond and return the principal to the investor. The option is exercised when interest rates are low and bond prices are high. Because the option has a long expiry (up to the maturity date of the bond), it has a large value. That value is spread over an uncertain coupon period (up to the call time, maturity time, or in between) in the form of a substantial yield premium over equivalent maturity non-callable bonds.
- The yield premium represents the compensation for general interest rate, yield curve, and volatility risks. Findings suggest that over the period 2008–2012, for example, upfront yield premiums exceeding 2 percent and realized yields of more than 5 percent were available on GE Capital’s callable bonds.
- While this experiment has been limited to GE Capital to come up with a variety of call/non-call comparisons, many large U.S. industrial corporations and municipal entities have had multiple outstanding callable bonds. As this form of financing is sure to endure, financial planners helping investors should learn how and when to include them in fixed income portfolios.
Robert Dubil, Ph.D., is an associate professor–lecturer of finance at the University of Utah in Salt Lake City, Utah. His latest book, Financial Engineering and Arbitrage in the Financial Markets, was published by J. Wiley & Sons in 2011.
This article aims to quantify the risks and rewards of callable bond investing. It proceeds as follows: First, the risks and rewards of callable bonds, within the general fixed income investing marketplace, are defined. The liquidity constraints and record low yields of corporate bond issuance of the last four years are then added as a backdrop. Then, the rich universe of GE Capital’s callable and non-callable bonds is used to quantify the yield rewards for bearing the risks of callable bonds. Upfront yield to call premiums as large as 4 percent and yield to maturity premiums as large as 2 percent are identified. Last, the performance of callable bonds over the last two years is traced to find bonds that did not get called and earned realized yields in excess of 5 percent, despite high credit quality and effective durations of less than three months.
A Review of Fixed Income Investing
Fixed income investors focus on two main risk/reward tradeoffs: interest rate sensitivity and credit quality. In the Morningstar (2012) fixed-income style box, interest rate sensitivity, which is measured by effective duration1, is divided into limited (duration < 3.5 years), moderate (3–6 years), and extensive (duration > 6 years)2. Credit quality is divided into low credit quality (below BBB), medium (less than AA, but greater or equal to BBB), and high credit quality (AA or higher). The definitions apply to all funds holding U.S. domiciled taxable and non-taxable (municipal) and non-U.S. domiciled corporate securities.
A fixed income investor, perhaps with the help of a financial adviser, evaluates his or her risk/reward profile and decides on the appropriate blend of bond funds. The two dimensions of risk are sometimes labeled differently from Morningstar compared to the name of the mutual fund (for example, short-, intermediate-, or long-term duration, and government, high-grade, mid-grade, or high-yield [credit quality]). The allocation may be affected by tax exemption considerations. Investors with larger portfolios perform the same risk/reward exercise, but may choose to buy individual bonds rather than bond funds. This may save on fund fees and allow precise risk and tax tailoring across sectors, coupon levels, and redemption times. In recent years, the improved price transparency in bond markets has made owning individual bonds easier.
One recipe for dealing with interest rate risk, reviewed by Bernstein (2003), and Bohlin and Strickland (2004), is the bond ladder. In a 10-year ladder, instead of investing $100,000 in one bond, an investor should allocate $10,000 to 10 bonds with increasing maturities of one to 10 years. Each year, the investor will reinvest the maturing $10,000 principal into a new 10-year bond. The average duration of the portfolio is a bit less than five years and it remains constant over time as the investor always holds the same distribution of one- to 10-year maturity bonds.
A version of a traditional ladder is a duration-weighted ladder in which one allocates more dollars to shorter (less sensitive) bonds and fewer dollars to longer (more sensitive) bonds to engineer the same dollar sensitivity to nonparallel changes in yields. Ingersoll, Skelton, and Weil (1978) show that a “barbell” or “dumbbell” portfolio with one short and one long bond can be constructed to have the same duration as the ladder, and as interest rates go up and down, the barbell can be rebalanced to produce the same exact results.
The allure of a ladder or barbell strategy is the diversification across shorter and longer bonds. This addresses the risk of parallel interest rate movements (if rates go up, a portfolio concentrated in long-term bonds might lose more money than a diversified one that includes shorter-term bonds) and non-parallel movements (if the yield curve steepens and long rates go up while short rates go down, the loss on the duration-sensitive long end may exceed the gain on the less sensitive short end).
When managing fixed income portfolios, it is useful to think in terms of rewards for three types of interest rate risk. The first is the parallel shift up in the yield curve, also called duration risk. The second is yield curve rotation—steepening, flattening, or inversion, with not all yields moving in the same direction or by the same number of basis points. The third risk is short-term volatility (size and speed of the changes) of interest rates.
Fabozzi and Mann (2008) review the broad use of risk measures such as duration, key rate duration, and convexity in fixed income portfolio management. Buetow and Johnson (2008) review the extensions of those measures (effective durations) to bonds with embedded options (callables and mortgage-backed). The “effective” measures are not absolute as they necessitate an arbitrage-free interest rate model, like Black, Derman, and Toy (1990). Cheung, Kwan, and Sarkar (2010) discuss the bond ladder idea in the mean-variance framework of a risk-averse investor.
Investing in callable bonds exposes investors to all three types of the interest rate risk. These bonds’ effective durations measure the exposure to the (parallel) rise of interest rates. The premiums built into their yields to call and yields to maturity reflect the slope of the yield curve and the volatility of the rates.
Call/Extension Risk of Callable Bonds
The main risk of a callable bond is the embedded short option that the bond holder provides the issuer. In Figure 1, a five-year 4 percent coupon bond callable in six months can turn out to be a six-month bond or a five-year bond, or a term in between, say, 18 months if the bond is callable American-style. The issuer exercises when the option is “in the money,” and interest rates have fallen low enough that the present value of the remaining coupons and principal3 exceeds par (plus any call premium). At that time, the holder would prefer to keep the bond but is forced to reinvest at a low rate. This scenario is referred to as call (or curtailment) risk. The bond is not called when interest rates are high. In that case, the holder might prefer to have the principal returned to be able to reinvest at a higher rate and not be stuck with a low-yielding bond. This scenario is referred to as extension risk. At mid-level yields, the bond extends, but if the original yield premium is high, the locked-in yield may still exceed yields on new bonds.
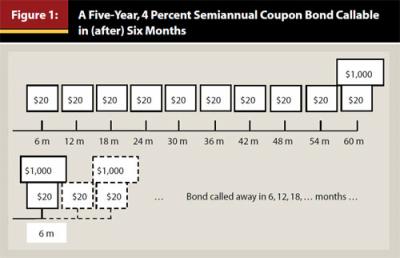
To understand the risk of a callable bond, think of covered call writing in equities. Suppose an investor buys a stock at $95 and sells a call struck at $100, receiving a premium of $1. There are three scenarios: (1) the stock goes down below $95, which results in a loss of money on the stock because the $1 premium may not be enough to offset the loss (extension risk); (2) the stock goes up above $101, which may result in the call being exercised, meaning the investor loses the upside of the stock and a premium that does not compensate for the loss of the gain (call risk); and (3) the stock goes up a bit but not higher than $101, which means the investor keeps the gain on the stock and the premium.
The callable bond’s short call option has a much longer maturity—many years—than a typical equity call resulting in a large yield premium. Unlike with equities, the bullet bond cannot be separated from the call option. This sets a price limit on the combined structure at par value4.
One can use the option theory’s put-call parity to view the callable bond in two equivalent ways: as a long-term (five-year) bullet (non-call) bond minus the call option (given to the issuer) to repurchase the bond at par in six months, or a short-term (six-month) bullet (non-call) bond minus the put option (given to the issuer) to sell a new four-and-a-half-year bond at par (sometimes plus a small premium). The put-call parity intuition extends to the bonds that are callable continuously or on coupon dates; to do so, it is a matter of substituting multiple-exercise American calls for the one-time European option. This dual view of callable bonds also helps explain the definition of the embedded risk as both call and extension risk. In low-rate scenarios, the high-value bond is taken away from the holder; in high-rate scenarios, the holder retains the low-value bond. The holder wins when rates do not go up or down much, the bond is not called, and the holder enjoys earning the extra yield.
The value of the embedded option, and the resulting yield earned by the bondholder, depends critically on two factors: the intrinsic “in-the-moneyness” of the option, and the volatility of the interest rates. The first is related to the difference between the coupon rate (which includes the yield premium) and the current level of interest rates as well as the slope of the yield curve. For example, a high coupon rate of 4 percent, while interest rates are at 2 percent, makes the call option likely to be exercised. Conversely, a low coupon rate of 2 percent, while interest rates are at 4 percent, makes the bond not likely to be called and to extend.
The option theory tells us that, in addition to the rate differential, which determines the current intrinsic value, the second factor, the volatility of the relevant interest rates, plays a critical role and is an added source of option value (called the time value). High volatility increases the probability of reaching future exercise scenarios. As a result, in highly volatile rate environments, new callable bonds tend to have higher yield premiums included in the coupon rates, reflecting the higher value of the call/extension option.
The most appealing feature of callable bonds is best illustrated in a flat yield curve scenario. Consider an issuer whose five-year and six-month bullet bonds sell to yield 3 percent. All maturities trade to yield 3 percent and the issuer can borrow money at 3 percent for any term up to five years. Using an arbitrage argument, no investor would accept a five-year callable bond with a coupon rate of 3 percent. Investors with a five-year desired maturity accepting 3 percent would be hurt if yields were to drop to 1 percent and the 3 percent bond were called. Investors with a six-month desired maturity accepting 3 percent would be hurt if yields were to rise to 5 percent and the bond were to extend. Both sets of investors would be better off choosing 3 percent non-callable bonds. To pay investors for the call/extension risk, the callable structure has to offer a yield higher than 3 percent, perhaps 4 percent. The extra 1 percent yield premium reflects the annuitized value of the embedded option. Note that the yield premium can be stated relative to the six-month bullet bond (yield to call) or to the five-year bullet bonds (yield to maturity). In the flat yield curve case, the two are the same.
One important lesson of the flat yield curve example is that the rate set on a callable bond (4 percent) can theoretically be higher than the interest rates on all bullet bonds observed in the market (3 percent). This also can be true in sloping yield curves. In the upward sloping case, of course, one would measure a larger differential relative to the call maturity (lower rate) than to the final maturity (higher rate).
Corporate Bond Markets After 2008
The 2008–2012 yield environment can be characterized by near-zero interest rates on sovereign borrowers. The spreads on large high-grade non-financial corporates skyrocketed in the 2008 crisis, but settled at very low levels by 2011. Some companies, such as IBM or Siemens, enjoyed negative spreads, at times paying less than many governments. Financial corporations’ spreads (for example, General Electric) fluctuated because of two offsetting factors: massive central bank capital infusions and exposure to insolvent sovereigns and non-performing real estate loans. Municipal securities enjoyed historically attractive tax-equivalent yields throughout the period.
The 2008–2012 years also saw dramatic shifts in investment flows. Benz and McDevitt (2012) report that $1.4 trillion left U.S. equity and money market funds between January 2009 and May 2012. Of that, $700 billion poured into taxable bond funds. By comparison, the period 1995–2000 saw inflows of $650 billion into equities and $600 billion into money markets, most of that being new investments. Faber (2012) reports a $24.1 billion inflow into high-grade corporate bonds and a $73 billion outflow from money markets in the first four months of 2012, as well as a $7 billion inflow into high yield in just one week in April 2012. The flows out of equities typically have been attributed to a secular “de-risking” of aging baby boomers’ portfolios, while the flows out of money markets to yield chasing.
Figure 2 shows the (ask) yield curve of non-callable bonds of General Electric Capital relative to the U.S. Treasuries on July 5, 2012. The data were downloaded using Vanguard’s Bond Desk application and verified against FINRA’s site.
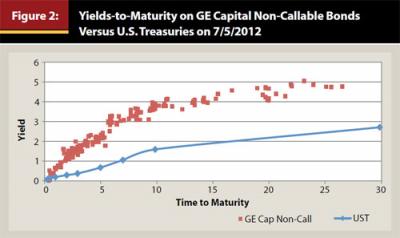
Over the preceding 10-month period, the Treasury yields declined and the curve flattened. Yield spreads on bullet GE bonds declined slightly, despite the credit downgrade by Moody’s from Aa2 to A1 (the S&P rating remained at AA+), but remained high by historical standards at over 200 basis points in parts of the yield curve. GE Capital traded at tighter spreads than its bank peers (Wells Fargo, JP Morgan, and Bank of America). Because 2008 represents predominantly a crisis of liquidity, many U.S. corporations officially changed their financing policies. The main shift was the move away from short-term financing like repo5 and commercial paper to alternative financing and extreme long-term issuance (50-, 100-year bonds), including callables.
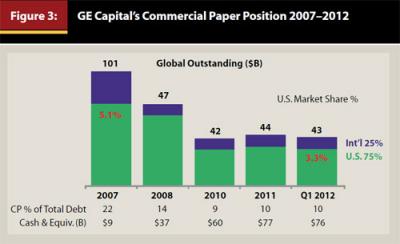
According to the GE Capital (2012) Liquidity and Funding Overview, General Electric reduced its outstanding commercial paper (CP) from $101 billion in 2007 to $43 billion in the first quarter of 2012. GE replaced it with deposits, intermediate-, and long-term financing. The firm’s stated goal was to keep $50–60 billion on hand, rather than reduce the total interest cost. Figure 3 illustrates GE Capital’s CP position. Malone (2012) quoted GE’s CEO saying that the company would further reduce its outstanding CP to $25 billion. Caterpillar, Dow Chemical, and Bank of America also issued new callable paper in 2008–2012.
Yield Premium on General Electric Callable Bonds
In U.S. corporate markets, the yield to call is the semi-annual yield (on a 30/360 basis) assuming the bond is called on the first call date and the investor receives only the coupons up to the call date. The yield to maturity is the semi-annual yield assuming the bond is not called and the investor receives all the coupons on the bond. The yield to worst is the lower of the two yields.
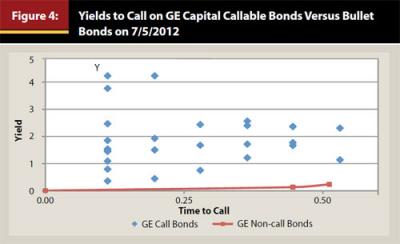
To illustrate the reward for call/extension risk on July 5, 2012, the yields to call on 31 callable GE Capital bonds were computed and compared to the yields to maturity on those of the 170 non-callable GE Capital bonds that were set to mature on the callable bond’s call dates. The vertical distance in the graph of Figure 4 represents the extra yield the callable bond holder would earn over the bullet bonds if the bonds are called. In Figure 4 the yields to call are also the yields to worst for all the callable bonds in the data set.
Another way to illustrate the reward for call/extension risk on July 5, 2012, is to compute the yields to maturity on the 31 callable GE Capital bonds and compare them to the yields to maturity on those of the 170 non-callable GE Capital bonds in my database that mature on the callable bond’s maturity dates. The vertical distance in the graph of Figure 5 represents the extra yield the callable bond holder would earn over the bullet bonds if the bonds are not called.
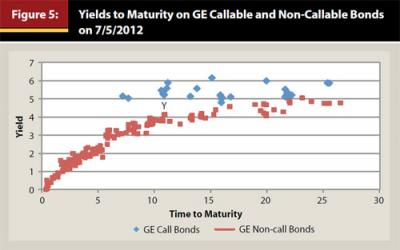
The 31 callable bonds in Figures 4 and 5 are the same, just plotted against the time of call and the final maturity, respectively. The 5.25 percent of 2023, marked with “Y” in both figures, offered a yield to maturity premium of 1.13 percent in Figure 5, and a yield to call premium of about 4.22 percent in Figure 4, over the equivalent bullets.
Table 1 shows the details of the analysis by comparing the yields on the callable bonds versus the yields on the nearest maturity non-callable bonds on July 5, 2012. Panel a of Table 1 shows the callable bonds with the largest yield to maturity premium corresponding to the highest points in Figure 5 in each maturity category. The yield premium is computed as the difference between the yield to maturity of the callable bond and the interpolated yields of two of the closest maturity non-callable bonds. The 6.200 percent of 8/15/2027 in Panel a, callable next on 8/15/2012, had a yield to maturity of 6.156 percent, while the nearest non-call, the 4.400 percent of 10/15/2027, had the yield to maturity of only 4.155 percent. Its yield to call was a low 0.796 percent reflecting the high likelihood of call.
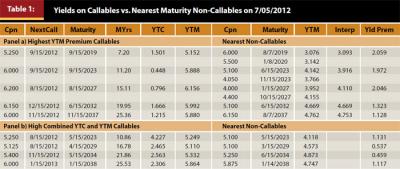
Panel b of Table 1 illustrates four callable bonds across different maturity categories with a combination of high yields to maturity and high yields to call. For example, the 5.250 percent of 5/15/2023 in Panel b, next callable on 8/15/2012, had the yield to call of 4.227 percent and the yield to maturity of 5.249 percent, while the nearest non-call, the 5.100 percent of 5/15/2023, had the yield to maturity of only 4.118 percent.
GE Callable Bond Performance over 2011–12
Theoretically, without computing the optimal exercise boundaries in a term structure model, one cannot tell whether the bonds in Figures 4 and 5 should or should not be exercised by the issuer. Optimal exercise occurs when the present value of the bond’s cash flows is equal to the unexercised value of the option. Practically, a corporate issuer is not interested in monetizing the option, but in deciding whether it is cheaper to call the bonds and incur costs to issue new ones with a lower yield. The issuer also may consider leaving the calls unexercised to manage liquidity risk6. In the next exercise, it is not possible to distinguish whether the unusually high realized yield paid to the investors by GE comes from optimal exercise or liquidity considerations.
Consider callable bonds trading at or above par on two dates: 9/06/2011 and 1/18/2012. When these are matched to the same bonds at a later date (7/05/2012) it becomes clear that if they are still unexercised, investors will earn a high fixed rate on loans that could have been refinanced by the borrower, but were not7. The results are shown in Tables 2 and 3.
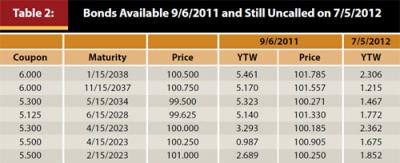
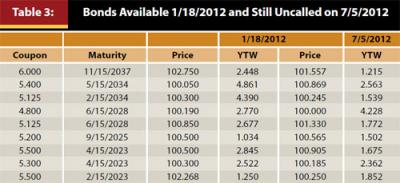
Tables 2 and 3 show very high coupon rates earned by investors on the uncalled bonds. The effective durations of the bonds are shorter than the next coupon dates (little price risk). Investors can earn the high coupon rates as long as they are willing to live with the period-to-period uncertainty of the call. This is similar to having issued a credit card to GE, earning high interest on it, and understanding that the balance can be paid in full anytime.
Conclusion
Fixed income investing has evolved from being a “safe” asset class, cushioning the risk of equities in the overall asset allocation plan, to being a significant source of return itself. In recent years, investors have shifted large amounts of capital from equities into bonds, and have piled into higher duration and higher credit risk segments of the bond markets.
As more and more investors become “bankers” rather than stock pickers, callable bonds should fit into the “loan portfolio” of these bankers-investors. The compensation to the investor comes not from exposure to credit risk, but from interest rate volatility risk and from servicing the issuer’s need for revolving credit and managing liquidity. Ex ante, the compensation is built into the higher yield to call and yield to maturity relative to non-callable bonds. Ex post, the compensation is the high realized return on unexercised bonds. While this study is limited to GE Capital to come up with a large sample of unexercised bonds and call/non-call comparisons, numerous large U.S. industrial corporations have many callable bonds outstanding (Caterpillar and Dow Chemical, for example). This form of financing is sure to endure, and we, the financial planners helping investors, should learn how and when to include them in fixed income portfolios.
Endnotes
- The modified duration of a bond portfolio is the percentage change (in the opposite direction) in the value of the portfolio per unit change (1 basis point or 1 percent) in the level of interest rates. The effective duration is a general definition of the modified duration applied to all bonds, including bonds with embedded options (such as mortgage bonds, callable bonds).
- The exact cutoff points fluctuate over time based on the Morningstar Core Bond Index.
- More precisely, plus the value of future exercises for a callable bond exercised any time American-style.
- Plus the present value of the next coupon minus the accrued interest.
- A repurchase agreement, or a repo, is a form of collateralized short-term financing structured legally as a sale of collateral and a repurchase at a higher price of the same collateral at a later date, typically the next day or within one week.
- The analogy to equity calls may be that you bought the stock at $95, sold $100 calls for $1, and when the stock goes to $100.50, the owner of the option does not exercise if raising money to buy the stock is too costly for him or her.
- Intuitively, the investors in these bonds are like banks sitting on high fixed rate mortgage loans that should have been refinanced. Prepayment statisticians document many reasons for the slow refinancing: low seasoning (recently refinanced or moved in), interest rate path-dependence, and personal reasons. For GE, it could be the stated policy of avoiding cheap CP refinancing and cash flow targeting.
References
Benz, Christine, and Kevin McDevitt. 2012. “Do Fund Flows Show a Bond Bubble?” Morningstar 11-May-2012. www.morningstar.com/videos/553930/do-fund-flows-show-a-bond-bubble.aspx.
Bernstein, Phyllis J. 2003. “Investing After 50. Keep the ‘Gold’ in Your Golden Years.” Journal of Accountancy 195 (June): 20–27.
Black, Fischer, Emanuel Derman, and William Toy. 1990. “A One-Factor Model of Interest Rates and Its Application to Treasury Bond Options.” Financial Analysts Journal 46, 1 (Jan/Feb): 33–39.
Bohlin, Steven, and George Strickland. 2004. “Climbing the Ladder: How to Manage Risk in Your Bond Portfolio.” American Association of Individual Investors Journal: 5–8.
Buetow, Gerald W. Jr., and Robert R. Johnson. 2008. Effective Duration and Convexity. Ch. 14 in Handbook of Finance, Volume 3, Valuation, Financial Modeling and Quantitative Tools, ed. Frank J. Fabozzi: 15–158. Malden, Massachusetts: John Wiley & Sons Inc.
Cheung, C. Sherman, Clarence C.Y. Kwan, and Sudipto Sarkar. 2010. “Bond Portfolio Laddering: A Mean-Variance Perspective.” Journal of Applied Finance 20, 1:103–109.
Faber, David. 2012. “Funds Flow into Bonds.” The Faber Report CNBC 27-Apr-2012. http://video.cnbc.com/gallery/?video=3000086877.
Fabozzi, Frank J., and Steven V. Mann. 2008. Yield Curve Risk Measures. Ch. 16 in Handbook of Finance. Malden, Massachusetts: John Wiley & Sons Inc.
GE Capital: Liquidity and Funding Overview. 1Q2012. www.ge.com/investors/investor_updates.html#.
Ingersoll, Jonathan E., Jeffrey Skelton, and Roman L. Weil. 1978. “Duration Forty Years Later.” Journal of Financial and Quantitative Analysis 13, 4: 627–650.
Malone, Scott. 2012. “GE’s Immelt Still Aims for ‘Smaller’ Finance Arm.” Reuters, May 23.
Morningstar. 2012. “Morningstar Fixed Income Style Box Methodology.” A Morningstar Methodology Paper (April).