Journal of Financial Planning: November 2013
Mark W. Riepe, CFA, is a senior vice president at Charles Schwab & Co. Inc. and president of Charles Schwab Investment Advisory in San Francisco, California.
January is just around the corner, and it isn’t too early to start thinking about whether we should pay any particular attention to it.
I’m not talking about the well-known “January effect” where small cap stocks perform exceptionally well in January compared to the stock market as a whole. I’m speaking of a different January phenomenon where the performance of the stock market in the month of January is correlated with the performance of the market during the rest of the calendar year.
There are two versions of this hypothesis. The narrower form of the hypothesis states that when the U.S. stock market in January is positive, the rest of the year will be positive. The broader version states, “As January goes, so goes the rest of the year.” In other words, a positive (negative) January is associated with a positive (negative) return for the market in the February to December period.
Comparing the Hypotheses
It’s easy to see why the narrow version has adherents. Let’s compute two sets of numbers. First, the total returns in January for the S&P 500 going back to 1926. Second, the total returns for the S&P 500 for the February to December period within each year. What we see is startling.
When the market rises in January, the market’s total return over the subsequent February to December period is positive 80 percent of the time (44 out of 55). Note that I included 2013 in the analysis even though the year isn’t finished. The reported metric (percent positive) is subject to the fair criticism that even small positives for the February to December period are counted as “hits,” but tiny positive returns aren’t driving these results. In only two of the 44 times has the February to December positive return been less than 8 percent.
I have two other general criticisms about calendar anomalies. First, their efficacy is often reported over long histories. Left unexamined are the long periods within those histories where the anomaly doesn’t work. Second, the results often are dominated by years in the early part of the time series, and more recent periods (when the anomaly was more well known) show mixed results. Neither criticism applies in this situation.
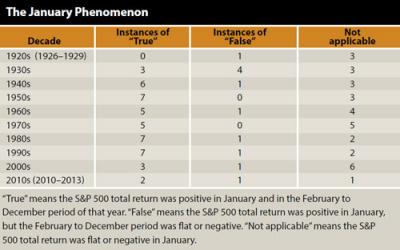
As seen in the table, the only decades to have results strikingly different from the long-term average were the 1920s and 1930s. Therefore, it is only the old (presumably least relevant data) that is unsupportive. Every other decade shows the same pattern.
The broader version of the hypothesis where January is predictive of both positive and negative returns has less support. There have been 34 years in which the S&P 500 total return was flat or down in January. In only 14 of those years (or 41 percent of the time) did the S&P have a flat or negative total return over the subsequent February to December periods.
A Common Factor at Work
The broader hypothesis that claims, “As January goes, so goes the rest of the year” is clearly the more desirable hypothesis a priori. It’s a hypothesis that is clear, has a pithy slogan to go along with it, makes unambiguous predictions that are testable, and is comprehensive in that it purports to explain both up and down markets. Unfortunately, aesthetics aren’t everything especially when it comes to investing strategies. A hypothesis needs to work; it needs to make accurate predictions, and in this case that just isn’t happening.
The narrower version has a remarkable track record on its side. However, like many calendar year anomalies, there’s a nagging doubt as to whether there really is any causation involved. In this case, is there really something about a positive market performance in January that causes a positive return for the rest of the year? It seems unlikely.
What seems more likely is that there is a common factor at work. For example, let’s assume that if market conditions are favorable to equity investors during January and these conditions aren’t fully anticipated by investors collectively, then the result is a positive return for January. Let’s further assume that whatever those conditions are, there is a tendency for those conditions to persist over time and, again, investors are surprised by these conditions resulting in an underpriced condition. If this were to happen, we’d see positive returns in January as well as the rest of the year. The driving force has nothing to do with January, but everything to do with underlying market conditions that tend to persist over time.
If this is the case, we should be able to take another month and do the exact same analysis we did with January. Let’s try it with February. Fifty-one times the S&P 500 has had a positive return in February since 1926. After those 51 positive months, the market also was positive in the subsequent March to December period 41 times, or 80 percent. These results are virtually identical to those of January. As for months when February experiences a flat or negative return, this has happened 37 times, but the subsequent March to December period was flat or negative only 13 times (35 percent). Again, the results are virtually identical to those of January.
How about March? March has had a positive return for the S&P 500 55 times since 1926. After those 55 positive months, the market also was positive in the subsequent April to December period 42 times, or 76 percent. These results are virtually identical to what we saw with January and February. As for months when March experiences a flat or negative return, this has happened 32 times, but the subsequent April to December period was flat or negative only 10 times, or 31 percent). Again, results are virtually identical to January and February.
Viewed through this lens, there’s nothing particularly special about January. February and March do just as well. Nevertheless, the fact that February and March exhibit a similar pattern doesn’t explain why such striking results show up in the data.
What’s an investor to do? I think this is a situation that investors confront all the time. An investor is presented with powerful back test results that offer the promise of attractive results, but it isn’t clear why the results have occurred, and it’s even less clear whether the results will persist over time.
Do you dive in and take advantage of the opportunity even if you don’t fully understand what’s going on? Or is the better approach to fall back on the maxim of only investing in what you understand? To me, the latter seems to be the more prudent option, but I’m willing to admit that if the market rises in January, I’ll be feeling more positive about the rest of the year.