Journal of Financial Planning: October 2011
Joachim Klement, CFP®, CFA, is partner and chief investment officer of Wellershoff & Partners Ltd. In this role he works with private banks, family offices, and institutional investors to develop asset allocation strategies and manage portfolios.
Executive Summary
- Traditional valuation measures such as P/E ratios have long been recognized as a reliable source of outperformance in stock selection processes. Greenblatt (2006) and Montier (2007) show that stock selection processes can be improved by combining valuation measures with profitability measures such as return on assets (ROA).
- In this paper, the author argues that earnings stability, defined as the historic standard deviation of corporate earnings, is another criterion that can enhance stock selection processes.
- The author tests earnings stability as a source of alpha for five country-based stock market indices—as a single source of alpha as well as in combination with other indicators.
- The paper finds that although earnings stability as a sole indicator has limited use, it can enhance stock selection processes based on traditional valuation and profitability ratios. It does so by eliminating stocks of companies with highly volatile, unpredictable earnings that may suffer from overly optimistic investor expectations, thus reducing portfolio volatility.
Stock selection based on valuation criteria such as price-earnings ratios (P/E ratios)—or similar ratios based on sales, book value, or the like—has long been done by some investors to identify attractive investment opportunities. A comprehensive approach to stock selection was provided as early as 1934 by Benjamin Graham and David Dodd.1 During the past 76 years, their approach to value investing has been generally accepted as one reliable and profitable approach to stock selection, among others, successfully applied in different market circumstances. However, a value-driven approach to stock selection as outlined by Graham and Dodd2 requires intensive study of the fundamental soundness of business practices of every company under consideration. Even in a world of increased availability of information and increased computing power, this examination usually requires a lot of time and is costly.
Investors over the years have tried to define a simplified approach to value investing based on a few reliable and easy-to-calculate indicators for each stock. Ben Graham offered advice toward the end of his life as to how such a simplified approach could look (see Lowe (1999)). More recently, Greenblatt (2006) distilled Graham’s approach to value investing into two variables:
- (Earnings before interest and taxes (EBIT))/(enterprise value) as a measure for value superior to classical earnings yield (a variation of the inverse of the P/E ratio)
- Return on capital (ROC) defined as EBIT/(net working capital plus net fixed assets) as a measure of the profitability or earnings quality
In his approach, Greenblatt ranks every company based on these two criteria—the company with highest earnings yield or highest ROC receives the lowest rank—and then sums the two ranks to give a combined score for value and quality. Greenblatt advocates buying the 30 highest-ranked stocks based on this combined score.
Montier (2007) tests Greenblatt’s method for the U.S., U.K., European except U.K., and Japanese markets and finds that this method outperforms their respective market benchmarks by 3.6 percent to 10.8 percent per annum between 1993 and 2005. This excess return was achieved at a portfolio risk typically 10 percent lower than the volatility of the benchmark. Montier also tests simplified versions of the Greenblatt method using the classical earnings yield instead of the modified earnings yield of Greenblatt, along with return on assets (ROA) instead of ROC. He finds that although the original Greenblatt method usually provides the best results in the different regions, the results based on classical earnings yield and ROA are generally comparable.
Earnings Stability as an Additional Criterion for Value Investing
The problem with using current earnings to calculate P/E ratios and ROA is that some companies have more volatile earnings than others. Investors using past earnings at a cyclical peak may significantly overestimate future earnings and future profitability of the company. Analysts’ earnings estimates are also often overly optimistic, especially around cyclical highs and especially for companies with more cyclical and hence less predictable earnings (see Spiwoks and Hein (2007)). Selecting companies based on expected earnings may create estimation errors, which might reduce the returns achieved with this approach. Earnings stability (measured in this study as the historic volatility of earnings) as an additional criterion in the stock selection process, however, may enhance the performance of an actively managed portfolio of value stocks by favoring companies with a high earnings stability, and thus higher predictability of future earnings, over companies with more volatile and less predictable earnings.
To see how this works, imagine a stock trades at 100 in Year 1, with ordinary (repeatable) earnings per share of 10. The P/E ratio of this stock would be 10, and the ROA would depend on the value of the total assets of the company. Now imagine a second company with extraordinary earnings of 20 and ordinary earnings of 0, trading at a share price of 100. The P/E ratio of this company would be 5, and—assuming the same total assets as the first company—the ROA would be higher than the ROA of Company 1, even though the earnings of Company 2 are non-repeatable in nature and next year’s earnings will likely be much lower than the current year’s earnings. From an investment perspective, Company 1 seems to be the better investment, but Greenblatt and Montier would favor the second company over the first.
Given that earnings stability might enhance stock selection when used in combination with valuation and profitability ratios, there might even be circumstances in which earnings stability may lead to superior stock selection on its own. If investors tend to overestimate future earnings after a period of strong earnings growth and underestimate future earnings after a period of low or negative earnings growth, then companies with more stable earnings should on average earn a superior return for investors than companies with more volatile earnings. This can be shown by assuming that a stock trades at 100 in Year 1 and has earnings per share (EPS) of 10. In Year 2 earnings per share may rise to 15. Based on this 50 percent increase in EPS, investors may speculate for another 50 percent earnings growth in Year 3 and bid up the price of the stock. If the company then earns 15 in Year 3, the negative surprise might cause the stock to collapse. Compare this with a company with EPS of 10 in Year 1 and 12 in Year 2. If the company can repeat the 20 percent earnings growth in Year 3, and produce an EPS of 14.4, the stock price would most likely slowly rise over both years and investors would earn a higher return in Year 3 with the second stock than with the first stock.
Another way to think about the same problem is to consider the risk premium paid on a stock. The more uncertain future earnings are, the higher the risk premium investors should demand. Thus, a stock with more volatile earnings should see its returns drop because a higher risk premium demanded by investors directly leads to a lower present value of future cash flows and therefore a lower share price. Similarly, a company with higher earnings stability should see a declining risk premium over time that should increase stock prices.
There is contradictory evidence on the question of whether forecasted earnings growth is biased by past earnings growth, but Best et al. (2006) show that companies with high expected earnings growth systematically underperform companies with low expected earnings growth. Also Lakonishok et al. (1993) demonstrate that investors tend to extrapolate past earnings too far into the future and bid prices of growth stocks up to levels that cannot be justified by future earnings growth. Given these indications, earnings stability alone might be a way to select attractive stocks over less attractive stocks characterized by more volatile earnings.
Methodology
In this paper I restrict my analysis to the use of earnings yield and ROA in comparison and/or in combination with earnings stability for the following five equity markets (because these are the five markets our Swiss company researches):
- Swiss stock market based on the Swiss Performance Index (SPI)
- U.S. stock market based on the S&P 500 Index
- U.K. stock market based on the FTSE 100 Index
- Eurozone stock market based on the EuroStoXX 300 Index
- Japanese stock market based on the Nikkei 225 Index
We calculate the P/E ratio of every stock in the index at the end of the year based on trailing 12-month earnings. Similarly we calculate the current ROA based on trailing 12-month earnings for each stock, and we define earnings stability as the standard deviation of quarterly earnings over the past 10 years, or since the beginning of our historic time series if an entire 10-year period is not available in our database. All data are retrieved from Thomson Financial Datastream, and our back-testing period covers the years 1990–2010 (1996–2010 for Switzerland because 1996 was the inception of the SPI). Out of every index we rank every stock annually based on P/E ratio (lowest P/E ratio ranked 1), ROA (highest ROA ranked 1), and earnings stability (lowest earnings volatility ranked 1). Based on each criterion we select the 30 best stocks of the index each year and form an equally weighted portfolio of these 30 stocks that we hold for one year. This methodology is identical to the one used by Greenblatt (2006) and Montier (2007), in order to achieve comparability of our results with theirs. In order to eliminate possible biases because of unavailable annual report data at the beginning of the year, the portfolios are formed on April 1 of each year and held for 12 months to March 31 of the following year. This ensures that at the time of investment, company earnings for the past year are indeed available.
If we want to combine several of these indicators into a new model, we simply take the sum of all the ranks of every single indicator included in the model. After one year, the process is repeated. Transaction costs are not taken into account, but the historical turnover of the resulting portfolios is minimal and typically much less than 100 percent per year, so that transaction costs do not eliminate the performance advantage shown in Montier (2007). Based on this analysis we calculate different measures of performance and risk for the portfolios of selected stocks as well as for the benchmark. These measures are:
- The raw performance difference between the reference benchmark index and the selected stock portfolio.
- The tracking error of the selected stock portfolio versus the benchmark. The tracking error is calculated as the standard deviation of the annual performance differences.
- The alpha and beta of the selected stock portfolio versus the reference benchmark. Beta is defined as the simple CAPM approach developed by Sharpe (1964) and others, and alpha is defined as Jensen’s alpha (1968).
- The information ratio of the selected stock portfolio is defined as alpha divided by the standard deviation of annual alpha (Reilly and Brown (2003)).
- The percentage of years when the stock portfolio underperformed the reference benchmark.
Swiss Results
Figure 1 summarizes the results for the Swiss case and shows the average annual outperformance versus the benchmark, the average annual tracking error versus the benchmark, the resulting information ratio, and the percentage of years when the performance of the stock portfolio is below the benchmark. We focus on five cases. The cases PE, ROA, and Estab denote stock portfolios selected based on one of the three indicators—P/E Ratio, ROA, or Earnings Stability alone. The case denoted Greenblatt shows the results for the simplified Greenblatt method using P/E and ROA. Finally, the case denoted 3 Factors shows the results for a combination of all three factors.
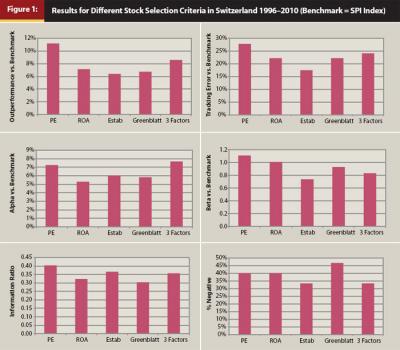
Figure 1 shows that earnings stability alone does provide a small outperformance and alpha compared with the benchmark SPI index, but generally at a lower information ratio than a portfolio based on P/E ratio or ROA. The number of years when the actively managed portfolios underperform the SPI, however, is comparable to using P/E ratio or ROA as a single criterion to construct actively managed portfolios. However, using earnings stability as a selection criterion reduces portfolio beta from values around 1 to 0.74. We also see that for the Swiss stock market, the simplified Greenblatt method does provide similar results in terms of outperformance and information ratio as the ROA criterion alone. Selecting stocks based on P/E ratios did historically lead to higher outperformance versus the benchmark, but at the cost of a higher tracking error and higher beta. Adding earnings stability as a third criterion however, does seem to add value, because the outperformance in the back-testing starts to rise and beta is reduced because of the absence of stocks with high earnings volatility and thus high price volatility. As a result, the information ratio for the Swiss market rises from 0.30 in the case of the Greenblatt two-factor model to 0.36 in the case of the three-factor model (although this is not statistically significant). What is more, the percentage of years in which the stock portfolio underperforms the benchmark drops from 47 percent to 33 percent.
The Greenblatt method is not designed to outperform the market every year. Instead it is designed to generate outperformance over three- to five-year horizons. We have therefore tested our results for these investment horizons as well.
We found that the investment horizon increases the benefits of earnings stability—the Greenblatt method and the three-factor model increase dramatically—and the effectiveness of ROA as a selection criterion is reduced. This improved performance over longer time frames results mostly from reductions in tracking error and beta. The reduction in tracking error leads to higher information ratios for longer investment horizons. Similarly, alpha increases for longer investment horizons because beta declines and the raw outperformance versus the benchmark remains rather stable.
I conclude that in the case of the Swiss stock market, earnings stability seems to be a criterion that can inform stock selection decisions, but most effectively in addition to existing selection criteria such as valuation and profitability. The value-added of earnings stability increases as the investment horizon increases.
Results from Other Countries
The key difference between the Swiss stock market experiment and the stocks in other regions is that the Swiss benchmark index SPI is populated with more small-cap stocks than the benchmarks we look at in the other regions. Because it is more likely that small- to medium-sized companies have more volatile earnings than international large-cap stocks, it seems plausible that the Swiss results are more responsive to earnings stability as a selection criterion than the large-cap universes in other countries.
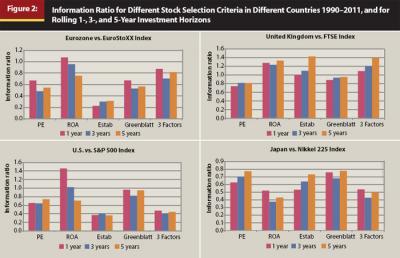
Figure 2 shows the information ratio for investment horizons of one, three, and five years for stocks from the Eurozone, the United Kingdom, the United States, and Japan. The results are mixed. Earnings stability as a sole criterion to select stocks does perform better than any other criterion in the United Kingdom and in Japan, and it performs worse in the Eurozone and the United States. Similarly, adding earnings stability as a third factor to the Greenblatt method does improve the information ratio in the Eurozone and the United Kingdom, but leads to a lower information ratio in the United States and Japan.
Observation of tests in different regions shows that earnings stability generally does provide additional information that enhances the performance of the stock selection process when used in isolation, but even more so when used in combination with classic selection criteria such as P/E ratios and ROA. The additional value provided by earnings stability lies less in the generation of additional outperformance versus the index and more in reducing tracking error and beta versus the benchmark, while leaving the overall performance mostly unchanged. The lower beta typically leads to higher alpha because raw outperformance is mostly unchanged, and the lower tracking error typically leads to higher information ratios.
Conclusion
In this paper I have tested whether earnings stability, defined as the historical volatility of corporate earnings, can inform stock selection processes as a stand-alone criterion and in combination with more traditional stock selection criteria such as valuation and profitability ratios. Tests in five different markets show that earnings stability as a stock selection criterion does add value when used in isolation, but that added value is generally small compared to the outperformance generated by more traditional stock selection criteria such as P/E ratios and ROA. However, earnings stability may provide useful additional information for stock selection processes when used in combination with these measures.
The results could indicate that this additional information of earnings stability is provided by eliminating stocks with high earnings volatility, which might be subject to investor over-optimism about future earnings growth. Thus, including earnings stability as an additional stock selection criterion generally reduces the volatility and tracking error of the actively managed stock portfolios versus the benchmark while leaving performance intact. As a result, the information ratio of a three-factor model including valuation measures, profitability measures, and earnings stability is generally higher than for a two-factor model excluding earnings stability. Also, the percentage of investment periods when an actively managed stock portfolio underperforms the benchmark is reduced when earnings stability is included in the stock selection process.
Earnings stability can be incorporated in stock selection processes as an additional variable to eliminate companies with less predictable earnings. In this way, financial planners may be able to build stock portfolios that achieve superior returns to a passive investment approach. The emotional reactions of many private investors over the past 10 years of volatile stock markets make it plausible that such a strategy of volatility reduction may in itself be valuable to investors and their advisers alike.
Endnotes
- Graham, B., and D. L. Dodd. 2009. Security Analysis. 6th ed. New York: McGraw-Hill.
- Ibid. Also: Graham, B. 2003. The Intelligent Investor. Rev. ed. New York: HarperCollins.
References
Best, R. W., C. W. Hodges, and J. A. Yoder. 2006. “Expected Earnings Growth and Portfolio Performance.” Review of Quantitative Finance and Accounting 26: 431–437.
Graham, B. 2003. The Intelligent Investor. Rev. ed. New York: HarperCollins.
Graham, B., and D. L. Dodd. 2009. Security Analysis. 6th ed. New York: McGraw-Hill.
Greenblatt, J. 2006. The Little Book That Beats the Market. Hoboken, NJ: John Wiley & Sons.
Jensen, M. C. 1968. “The Performance of Mutual Funds in the Period 1945–1964.” Journal of Finance 23: 389–416.
Lakonishok, J., A. Shleifer, and R. W. Vishny. 1993. “Contrarian Investment, Extrapolation, and Risk.” NBER Working Paper W4360.
Lowe, J. 1999. The Rediscovered Benjamin Graham: Selected Writings of the Wall Street Legend. Hoboken, NJ: John Wiley & Sons.
Montier, J. 2007. Behavioral Investing: A Practitioner’s Guide to Applying Behavioral Finance. Chichester, U.K.: John Wiley & Sons.
Reilly, F. K., and K. C. Brown. 2003. Investment Analysis and Portfolio Management. 7th ed. Mason, OH: South-Western.
Sharpe, W. F. 1964. “Capital Asset Prices: A Theory of Market Equilibrium Under Conditions of Risk.” Journal of Finance 19, 3: 425–442.
Spiwoks, M., and O. Hein. 2007. “Die Währungs-, Anleihen-, und Aktienmarktprognosen des Zentrums für Europäische Wirtschaftsforschung.” Wirt Sozialstat Archiv 1: 43–52.