Journal of Financial Planning: October 2011
Wade D. Pfau, Ph.D., an associate professor at the National Graduate Institute for Policy Studies in Tokyo, Japan, holds a doctorate in economics from Princeton University. His hometown is Des Moines, Iowa. He can be reached at wpfau@grips.ac.jp.
Executive Summary
- The aim of traditional retirement planning is to set a wealth accumulation target for one’s retirement date so that desired expenditures can be obtained using a “safe” withdrawal rate.
- But it is quite difficult to know if one is making progress toward this target. Volatility over short periods strongly limits the usefulness of using the current wealth accumulation at 10 years or even 5 years before retirement to predict final retirement wealth.
- Fortunately, it is not necessary to focus on a wealth accumulation target for the retirement date. The accumulation and retirement phases should not be treated separately in this way.
- This article outlines a framework for considering whether clients in mid-career are on track for a sustainable retirement. It investigates what combinations of savings rates and years of continued work would have allowed someone to have always accumulated enough by retirement to afford one’s desired retirement expenditures in all of the rolling periods from the historical data. A strategy is “safe” if it worked in the worst case offered thus far by history.
How do planners determine whether their clients are making proper progress toward their retirement goals? In traditional retirement planning, one would track a client’s progress toward a wealth accumulation target for the intended retirement date. That target would have been determined by first calculating how much clients would like to withdraw from their savings after accounting for Social Security benefits and other income sources. Planners would also describe the safe withdrawal rate literature to help clients decide on a withdrawal rate they feel comfortable using. It is then a matter of saving enough so that the withdrawal amount to obtain the client’s desired expenditures matches the predetermined safe withdrawal rate. Tracking progress in this framework then involves determining whether current wealth accumulation is sufficient to get clients to their intended target at retirement.
Pfau (2011b) argues that because of mean reversion (the lowest sustainable withdrawal rates tend to follow strong bull markets just prior to retirement, and bear markets in the final pre-retirement years tend to allow for higher withdrawal rates), the traditional framework may not be the best way to plan for retirement. Individuals whose careers end after a long bear market will be less likely to meet the wealth accumulation target linked to the safe withdrawal rate. But unless the economy really experiences a crisis much deeper than anything to date, a higher withdrawal rate can potentially be supported, and those individuals may not have needed so much wealth to be able to withdraw their desired expenditures anyway. Likewise, it is only reasonable that those who worked at a time that provided the easiest path for reaching a wealth accumulation target (a retiree in 2000) should expect something closer to the harshest post-retirement conditions. The traditional wealth accumulation target for the 2000 retiree may not be enough. Instead of wealth targets, as Pfau (2011b) explains, someone saving at her “safe” savings rate will likely be able to finance her intended expenditures regardless of her actual retirement date circumstances. This study extends the case further by arguing that even if a client really wants to achieve a particular wealth accumulation target, knowing whether she is on track to accomplish this even 5 or 10 years before retirement is really much harder than it appears (unless she happens to have already saved enough to lock in the target with fixed-income assets). It is rather difficult to track one’s progress toward a wealth target, but that target may not provide a good indication of retirement sustainability anyway.
The safe withdrawal rate literature tends to look at the retirement period without considering the preceding accumulation period. They really should be considered together. This means one should not aim for a wealth accumulation target at retirement, but rather aim to accumulate enough wealth to actually finance desired retirement expenditures. Because of mean reversion (a decade of below-average financial market returns just before retirement will most likely not also be followed immediately by another decade of below-average returns after retirement), these seemingly similar concepts can actually be quite different.
As an alternative, the way to know if a client is on track for a sustainable retirement is to consider hypothetical individuals with the same current situation and retirement plans as the client, but who reached the client’s current age at different points in history, and examine how these hypothetical individuals fared over rolling periods from the historical data. Then, a planner can determine what else must be done (what savings rate was needed over how many more years of work) so that all the hypothetical individuals from history facing the same current circumstances could have retired successfully. This allows clients to know if they are on track based on history’s worst-case scenario. To be sure, a more adventurous individual does not need to plan for success in the worst-case scenario, and a more risk-averse individual may like to plan for something even worse. Indeed, there is an important caveat that these “safe” strategies are only what would have worked in the worst-case scenario from the past. Future retirees may experience even worse market conditions, and this must always be kept in mind.
This paper provides a framework for mid-career individuals and their planners to develop a progress report about their retirement plans by showing which savings rate they may still need to use and how much longer they may still need to work. These findings will serve as a reality check for some if the results show that expecting to retire before age 80 or 90 will be difficult without a drastic change in plans. Others may find that they are already comfortably on the way to retirement with lower wealth accumulations than they may have otherwise thought possible.
Methodological Framework
I use a historical simulations approach, considering the perspective of mid-career individuals planning for events over the remainder of their lives, and charting a course that starts from each year in the historical period. I develop a baseline to facilitate discussion, but these assumptions can be modified to allow for any variety of real-world situations. My baseline assumptions include that these individuals wish to make plans for possible survival up to age 100, and tentatively plan to retire at age 65. They earn a constant real salary for each year of employment and contribute their new savings to their portfolio at the end of each working year.
In order to track progress toward retirement, I calculate the minimum savings rates that would have been required starting from each year in the historical period in order to accumulate sufficient wealth by age 65 to successfully withdraw one’s desired expenditures over the subsequent 35 years. The highest of these minimum necessary savings rates (the worst-case scenario from the historical record thus far) represents the “safe” savings rate for the remainder of their careers. I also consider that people may find their “safe” savings rate too high and may instead wish to use a lower savings rate but work longer than originally planned. I calculate how many years one would need to continue working while using a lower savings rate in order to have saved enough funds to finance retirement expenditures over the remainder of the time up to age 100. The term “safe” retirement age could be used in this context.
In the baseline scenario, savings are deposited into an investment portfolio allocated 60 percent into large-capitalization stocks (Standard and Poor’s Composite Stock Price Index) and 40 percent into short-term, fixed-income assets (annual yield from six-month commercial paper rates). The data for annual asset returns between 1871 and 2009 are from Robert Shiller’s website (www.econ.yale.edu/~shiller/data.htm). Rebalancing occurs annually, and the asset allocation remains fixed at all ages.
Withdrawals are made at the beginning of each year during retirement. Withdrawal amounts are defined as a replacement rate from final pre-retirement salary. The withdrawal rate this represents is not important in the framework, nor is the actual wealth accumulation when retirement begins. I assume that the baseline individual wishes to replace 50 percent of her final salary with withdrawals from her accumulated wealth. This 50 percent is more than it may initially sound, as it is only the part from retirement savings. Social Security benefits and any other income sources would be added on top of this. After retiring, one no longer has to save for retirement or contribute to Social Security, which increases the replacement rate with respect to what could have been spent before retirement. However, retirees must also plan for new expenses such as Medicare and Medigap premiums and prescription drugs, which could add substantially to necessary expenditures. Withdrawal amounts are adjusted for historical inflation in subsequent years. There are no taxes or portfolio administrative and planning fees. The replacement rate is defined in terms of gross salary, and any taxes due will necessarily result in a higher replacement rate in order to provide a given post-tax expenditure amount. A particular retirement strategy is successful if withdrawals can be sustained to at least age 100 without the account balance falling below zero.
To provide an example of the historical simulations, consider the situation for someone turning 55 at the start of the year. This person still has 45 years before reaching age 100. Rolling periods beginning between 1871 and 1965 can be considered, which result in 95 hypothetical individuals reaching age 100 at the start of 1916 through 2010. (Note in this particular example that those reaching age 55 after 1965 have not yet finished their retirement period, and are not part of the determination of history’s worst-case scenario.)
Charting Progress to a Wealth Target in a Sea of Volatility
A real problem plaguing the traditional retirement planning process that may not be well recognized is that it is difficult to know whether a client is on track to meeting a wealth accumulation target. Because of compounding returns, most of a portfolio’s growth will tend to occur just before retirement. Kitces (2010) describes this phenomenon well:
If there’s one thing that has remained certain in this decade of difficulty, it’s the gold standard advice for retirement planning: save a healthy amount of your income, start young, invest steadily, and you’ll be able to retire when you want to and enjoy the standard of living you hoped and dreamed for. Yet the reality is that this model of retirement planning advice excellence is actually far more speculative than we have ever acknowledged, and might be better summed up as: ‘Save for decades, build a base, and then in the last few years, quickly double up your wealth with investment growth and retire happily.’ We’d never say that to our clients ... yet in truth, that’s exactly what we have been recommending all along.
A portfolio earning a fixed 7 percent return, for instance, should double about once every 10 years. With this doubling, client nest eggs really are rather dependent on what happens in financial markets during their final working years. Shiller (2005) touched upon a related idea, having noted a concern with target-date funds (which reduce stock allocations as people get older). These funds maintain high stock allocations when people are young and have little saved, and low stock allocations when people are close to retirement and may have a much larger portfolio. Basu and Drew (2009) identify this phenomenon as the “portfolio size effect,” and argue for this reason that target-date funds reduce stock allocations at precisely the wrong time. Most of the portfolio growth will occur late in a worker’s career when larger portfolio balances will provide for more capital gains in absolute terms. Lowering stock allocations at this time can cause workers to miss their main opportunity for building wealth through capital gains. Pfau (2011a) examines the same evidence as Basu and Drew (2009), but concludes instead that workers with modest risk aversion may still prefer reduced stock allocations as they approach retirement in order to better avoid the extremely low wealth accumulations that occasionally result from higher stock allocations.
Given these considerations, reports of progress toward meeting a wealth accumulation target seem based too heavily on an assumption of constant portfolio returns. This might not be such a bad assumption on which to base an idea about saving when one is 30 or 40 years from retirement, but it is still always going to be the case that because a client is presumably contributing funds throughout her career, the order of returns matters. In addition, bad returns early in a career allow time to save more and recover, but a bad sequence near the end can be a much bigger problem. The specific returns earned in the final few years before retirement play a disproportionate role in determining the final accumulated wealth. The variation in real returns for a 60/40 portfolio over a period of even five years can be dramatic, hampering such planning efforts.
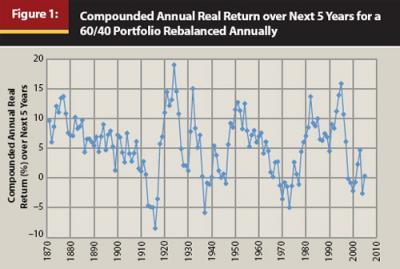
Figure 1 shows the compounded annual real return over the subsequent five years from a 60/40 portfolio over rolling periods from the historical data. Though the average compounded annual real return was 5.26 percent, the variation of returns over five-year intervals is still dramatic, ranging from as low as –8.5 percent for the five years starting in 1916 to as high as 19 percent for the five years starting in 1924. Real returns are negative in 21 of the 135 rolling five-year periods. Given how divergent events can be even in just the final five years, how can a client and her planner know if she is on track to meeting her retirement goals?
My aim is to answer this question, but first, suppose a client is aiming for a wealth accumulation target at retirement. Just considering how much wealth she already accumulated is not going to provide an adequate answer for how much she will have at the end. Pfau (2011d) begins with an illustration of this conundrum for two hypothetical individuals who lived and worked at different times in U.S. history. These two individuals each earned a constant real salary over 30 years, and they each contributed 10 percent of their salary at the end of each year to an annually rebalanced savings portfolio divided between 60 percent stocks and 40 percent fixed income. One individual retired in 1921 and the other in 2000. Figure 2 recreates the paths of their wealth accumulations over their respective 30 years of work. The 1921 and 2000 retirees are chosen for having accumulated the least and the most wealth of anyone in the historical period studied after a 30-year work period. In comparing these two individuals, the problem with knowing whether one is on track to meet a wealth accumulation target at a planned retirement date is that neither one of them could have had a clue about their upcoming record-breaking status even five years before their respective retirements. It was only in the final five years that events either went well or poorly for these individuals.
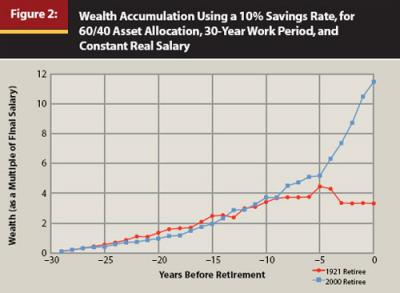
Figure 3 reveals that this lack of predictability is quite general and not an anomaly because of the extreme situations for the 1921 and 2000 retirees. This figure shows the accumulations for all the hypothetical individuals sharing these characteristics from rolling 30-year periods, comparing what these individuals had accumulated 10 and 5 years prior to retirement with their retirement date wealth. These numbers are expressed in real terms as multiples of the constant real salary. The blue lines identify the averages. What is important to note in Figure 3 is that a progress report from 10 years before retirement would provide almost no information about the final wealth accumulation. Only 5 percent of the variation in the final wealth accumulation could be explained by the wealth accumulation 10 years earlier. The remaining 95 percent is explained by subsequent market events. The largest and smallest wealth accumulations at retirement (the 2000 and 1921 retirees) both hover close to the average wealth accumulation at 10 years prior to retirement. At the same time, those who had accumulated the most at 10 years before retirement actually ended up with slightly less than the average amount at the retirement date, and those who had accumulated the least with 10 years remaining actually ended up with above average wealth accumulations at retirement. At five years before retirement, such a progress report is a little more helpful and now a positive relationship between the two accumulations can be better seen. However, it is still the case that the wealth accumulated five years before retirement explains only 34 percent of the variation in the final accumulation.
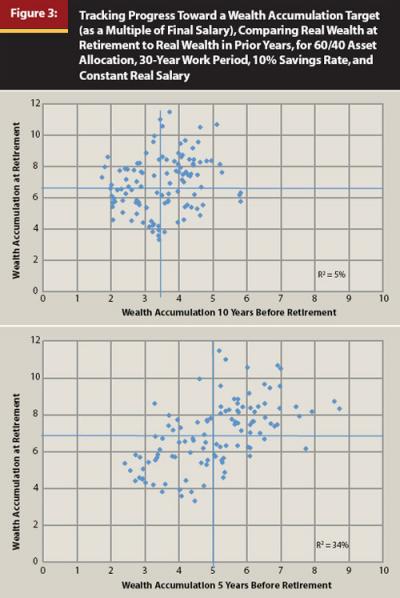
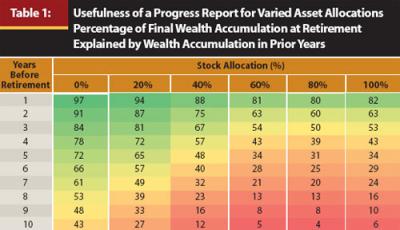
Table 1 extends the information from Figure 3 to show the degree of predictability for retirement date wealth provided by varied asset allocations and years before retirement. The predictability does improve as retirement approaches. The lower volatility of short-term fixed income allows for more predictive power as well. As can be seen, progress reports of this nature do not help much in predicting a client’s final wealth. Average long-term returns cannot be applied to short periods, as there is still too much volatility.
To obtain a bit more insight about this, suppose that the market drops 50 percent in the client’s final year of work. Half of what she accumulated over the previous 29 years disappears in the span of one year. But there is another way to think about whether you are on track for a sustainable retirement.
Getting 55-Year-Olds on Track for a Sustainable Retirement
To illustrate what must still be done before one can reasonably expect a successful retirement, consider a client age 55 who has accumulated wealth equal to four times her salary and who expects her salary to remain constant in real terms for the remainder of her career. Because of space constraints, this discussion will focus only on 55-year-olds. (Readers can find tables for individuals age 35, 45, 50, and 60 in Pfau (2011c). The table for 35-year-olds might be of particular interest for young people thinking about strategies to reach an early retirement.)
The 55-year-old plans to maintain a 60/40 asset allocation for the remainder of her life. She also estimates her potential retirement income from Social Security and other pension sources, subtracts these from her desired total retirement spending, and determines that she would like to replace 50 percent of her pre-retirement salary from her savings. She does not know how long she might live, and she decides that she wants to accumulate enough before retiring to last her at least through age 100. She first has in mind that she will retire in 10 years at age 65, and wonders what savings rate she will need to use over the next 10 years to save enough to make possible her subsequent 35 years of retirement expenditures.
Figure 4 demonstrates this savings rate for the 95 rolling 45-year periods starting between 1871 and 1965. If she was fortunate to have reached age 55 at times such as the 1870s, the years around 1920, and the late 1940s, then her current four-times-salary accumulated wealth would have proved enough that she could retire in 10 years without any new savings. This does not necessarily mean she could retire at 55, because she may still need the extra 10 years of compounding before retirement, and retiring today would require 45 years of withdrawals instead of 35 years. Nonetheless it is possible, though not likely, that she has already contributed enough to her savings and can rely only on subsequent capital gains.
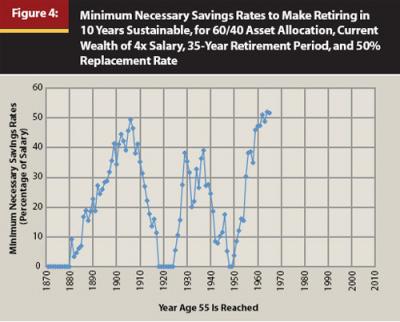
For the most part, though, she should consider that she still has a difficult road ahead to reach a “safe” retirement. Just to have a 50 percent chance for retirement success, she will need a savings rate of 18.9 percent over the remaining 10 years. Her “safe” savings rate, which is the highest minimum savings rate from history that would have resulted in sustainability, is 52 percent of her salary for the next 10 years. If she wishes to avoid retiring until she can be fairly confident about her situation, but she is unable to save at such a high rate, then she must face the reality that her goal of retiring in 10 years may not be realistic.
Next, if she thinks that a 15 percent savings rate is all she can bear, she wonders how many more years she will need to work before having accumulated enough to support her desired expenditures for the remaining time up to age 100. Figure 5 provides an answer. In four of the rolling historical periods, retirement would become feasible in as soon as three years, when she turns 58. The median case, which would allow for a sustainable retirement in half of the situations, is 11 years of continued work, allowing for retirement at age 66. To be “safe,” she should consider working until age 71. These solutions (save 52 percent per year for 10 years or save 15 percent per year for 16 years) provide two of many possible combinations that would have created a “safe” retirement plan in the worst-case scenario from history. Accumulating only four multiples of salary by age 55 leads to recommendations that may seem rather harsh, but this should serve as a reality check for her and her planner on what still needs to be done.
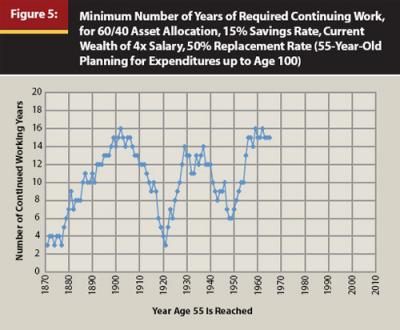
Table 2 expands what is shown in Figure 5 to provide the “safe” retirement age for someone age 55 who is planning for retirement expenditures up to age 100 for a variety of other circumstances with regard to current wealth accumulations, savings rates, stock allocations, and replacement rates. Each part of the table varies one variable against the wealth already accumulated at age 55. The first aspect of the table to note is that current wealth accumulation plays an important role in pushing one toward a sustainable retirement at a younger age. In some cases, the 55-year-old is already set to retire. For a 60 percent stock allocation and a 50 percent replacement rate, the first part of the table shows how the “safe” retirement age is affected by wealth accumulations at 55 and savings rates. For someone without any savings, retirement can still be possible at some point, though even with a 30 percent savings rate, retirement cannot safely begin for 21 years until age 76.
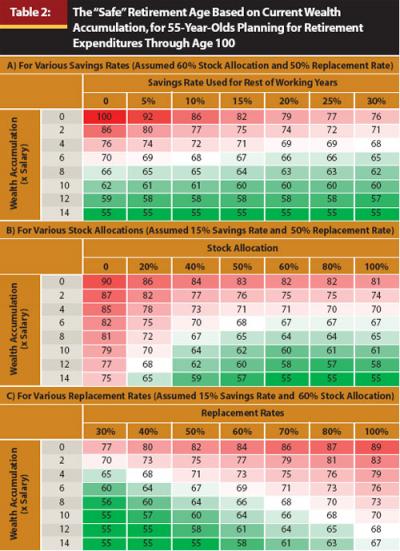
In general, the table shows that saving more after age 55 does assist in getting someone closer to a sustainable retirement more quickly. The second part of the table shows that increasing the stock allocation generally helps, but that stocks are also risky and that the differences in retirement ages between 50 percent and 100 percent stock allocations are small. Not letting the stock allocation fall too low is advisable based on this table, as a 55-year-old is still planning to maintain her asset allocation choice for another 45 years. A 60/40 asset allocation is quite competitive. Finally, the last part of the table shows that each incremental increase in the replacement rate has an important impact, and that budgeting to allow for a lower replacement rate in retirement can provide a viable option to help individuals lower their “safe” retirement age. For instance, by lowering her replacement rate from 50 percent to 30 percent, the baseline individual considered earlier, with a 15 percent savings rate, could reduce her retirement age from 71 to 65.
Conclusion
This study outlines a framework for determining whether a client is on track for a sustainable retirement. This is important because traditional wealth accumulation targets do not provide the most effective framework for retirement planning and because, even if they did, financial market volatility makes it hard to judge whether one is on track to meet such targets. As an alternative for judging the fitness of retirement plans, I extend the framework of Pfau (2011b), which simply integrates the pre-retirement and post-retirement periods to determine which actions should be taken prior to retirement in order to have accumulated enough to afford one’s desired retirement expenditures. The answers derive from what would have proved safe in rolling periods of the historical data. I investigated using the framework for someone age 55, mixing various facets of a retirement plan to provide a “safe” savings rate and retirement age guidelines.
This study does not incorporate all the necessary details for judging the feasibility of a retirement plan. First, a lot of thought must go into choosing a replacement rate: how the retirement age interacts with Social Security, Medicare, and other pensions; whether retirement spending should adjust with inflation; and how to account for unexpected expenditures. In subsequent research, annuities and the possibility that individuals may wish to leave bequests must also be incorporated to present a more complete picture of retirement possibilities.
Other concerns are administrative fees and whether individuals will use an investment strategy that matches the returns on the indices used as part of this research. Retirees who can outperform these indices, perhaps by diversifying into other assets that could not be incorporated because of the lack of sufficient historical data, may more easily find safety. But it is more likely that many retirees will not choose investments that can match these index returns, at least after fees are deducted, and will find that the numbers here underestimate what will be needed. A proper consideration of tax issues is also important. Further, many investors will not keep the same asset allocation over their lifetimes and will wish to use life-cycle asset allocation strategies that reduce the asset allocation based on age.
Table 2 may show some unrealistic retirement ages for people who would be unable to maintain their jobs for that long. However, such impractical retirement ages should really serve as a wake-up call about the unrealistic nature of one’s current plans. This framework is sufficiently different from the approaches used in existing planner software that it will be difficult for planners to immediately adopt it for clients, but I hope that further consideration from planners and software developers will help judge whether this approach can contribute to strengthening the retirement planning process.
References
Basu, Anup K., and Michael E. Drew. 2009. “Portfolio Size Effect in Retirement Accounts: What Does It Imply for Lifecycle Asset Allocation Funds?” Journal of Portfolio Management 35, 3 (Spring): 61–72.
Kitces, Michael E. 2010. “Is ‘Save for Decades, Then Quickly Double Your Money and Retire’ Your (Unintentional) Retirement Advice!?” Nerd’s Eye View blog (November 19). http://www.kitces.com/blog/archives/76-Is-Save-For-Decades,-Then-Quickly-Double-Your-Money-And-Retire-Your-Unintentional-Retirement-Advice!.html.
Pfau, Wade D. 2011a. “The Portfolio Size Effect and Lifecycle Asset Allocation Funds: A Different Perspective.” Journal of Portfolio Management 37, 3 (Spring): 44–53.
Pfau, Wade D. 2011b. “Safe Savings Rates: A New Approach to Retirement Planning over the Life Cycle.” Journal of Financial Planning 24, 5 (May): 42–50.
Pfau, Wade D. 2011c. “Getting on Track for Retirement.” Pensions, Retirement Planning, and Economics blog (June 29). http://wpfau.blogspot.com/2011/06/getting-on-track-for-retirement.html.
Pfau, Wade D. 2011d. “Can We Predict the Sustainable Withdrawal Rate for New Retirees?” Journal of Financial Planning 24, 8 (August): 40–47.
Shiller, Robert J. 2005. “Life-Cycle Portfolios as Government Policy.” The Economist’s Voice 2, 1: 1–8.
Acknowledgments: I am grateful for financial support from the Japan Society for the Promotion of Science Grants-in-Aid for Young Scientists (B) #23730272.