Journal of Financial Planning: October 2011
Robert Dubil, Ph.D., is an associate professor–lecturer of finance at the David Eccles School of Business at the University of Utah. He is a former director of corporate risk management and a derivatives trader at Merrill Lynch, as well as head of options trading at UBS and Chase.
Executive Summary
- Hedge funds are no longer only for the rich. Their tactics have invaded publically traded ETFs. With strategy indices tracking hedge fund performance, broker-dealers have started offering retail investors “index” funds aimed at replicating hedge fund returns.
- If hedge fund performance can be replicated through index-like vehicles, then are we getting alpha or beta from them? Early evidence suggests that the 2-percent-plus-20-percent fees are not always for managerial acumen, but perhaps for liquidity and access.
- This paper provides a classification of hedge fund strategies based on the logic of the relative value arbitrage pursued.
- The paper reviews the current state of the knowledge on the subject of hedge fund performance replication and the currently available vehicles to U.S. retail investors.
Hedge funds are lightly regulated investment funds open only to institutional or qualified (satisfying minimum wealth requirements) investors, with limited liquidity (quarterly or annual redemptions), that charge performance fees. The fee structure is typically 2 percent of assets under management plus 20 percent of profits. Both numbers can be higher or lower. The 20 percent incentive fee may be subject to high-water marking—that is, requiring the fund to make up losses first. As of Q2 2011, the hedge fund industry is estimated to have more than $1.9 trillion in assets under management, with perhaps as many as 8,000 funds in operation. The largest operators of hedge funds include J.P. Morgan Chase, Bridgewater Associates, Paulson & Co., Soros Fund Management, and D.E. Shaw Group, each in the $25–$55 billion range.
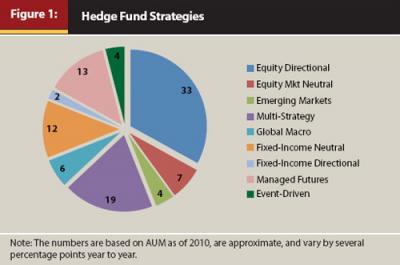
Although global macro, fixed-income, and event-driven funds often attract press coverage, more than 50 percent of all hedge funds employ strategies focused on equities. Figure 1 shows a breakdown compiled from various sources as of the end of the first quarter of 2010.1
Literature Review
As early as the late 1990s, academic researchers started doubting hedge fund claims to superior performance and superior manager skill (alpha). They asked three broad questions: are the 15 percent plus long-term return claims real? If so, is the performance persistent over time (luck or alpha)? If so, why, and can it be replicated with simpler alternatives (beta) at lower fees with daily redemption?
Many studies point out two main problems with hedge fund databases: backfill bias and survivorship bias. The latter causes the overstatement of overall returns, as failed funds are deleted from aggregate return calculations. Fung and Hsieh (2009) pointed out that when hedge funds migrate from one database to another, or databases are merged, performance has to be supplied for early years (backfill) or the fund has to be deleted (survivorship). Bollen and Pool (2009) found evidence that funds use discretion in valuing illiquid securities to temporarily overstate their returns. Bollen and Whaley (2009) showed the errors produced in trying to estimate alpha, or overperforming a benchmark, when the benchmark itself constantly moves (shift in asset classes, strategies, and leverage). Despite these problems, Griffin and Xu (2009) showed that hedge funds beat mutual funds in stock-picking by close to 1.5 percent, preferring smaller stocks, higher turnover, and concentrating bets. However, they found little evidence of differential ability between hedge funds (herding the same ideas?). Arnott and West (2008) explored the erosion of gross returns of funds of funds by fees (asset-based plus carry).
Early studies on performance persistence reached divergent conclusions. Brown et al. (1999) found no evidence of year-to-year persistence when controlling for survivorship bias. Agarwal and Naik (2000) found persistence in the 1982–1998 period, attributing it to superior mutual fund managers opening new hedge funds. Agarwal et al. (2009) further suggested that funds with generous managerial option-like incentives and discretion delivered better performance. Several studies documented that, similar to mutual funds, large size and fund inflows negatively affect subsequent performance. Boyson (2009) found strongest persistence in younger and smaller funds, which as a group also outperform older, larger ones by more than 10 percent. Eling (2009) provided a good synthesis of the various studies of performance persistence over the years. He attributes more of it to data biases than to option-like strategies.
Takahashi and Yamamoto (2008) classified replication strategies into factor-based, rule-based, and distribution replication and reviewed each one. Hasanhodzic and Lo (2007) were the first to test the linear factor-based replication models. They explained the serial correlation in hedge fund returns not with managers’ investment acumen (alpha), but as extra reward for illiquidity to which public market investors cannot gain exposure. Sadka (2010) showed that the loading on the covariation with aggregate liquidity is a significant determinant of a fund’s return, regardless of the fund’s strategy. Amenc et al. (2010) tested non-linear replication strategies. Their main findings were that non-linear and conditional models do not necessarily improve replication—choosing better economic factors does. However, the replication strategies systematically underperform the actual hedge funds. Brooks et al. (2007) showed how incentive fees obscure the true beta exposure of hedge funds. Research based on net returns tends to understate returns because of beta exposure by 60 basis points per year. Replication should be based on gross returns.
Fung and Hsieh (2007) reviewed the rule-based replication. Fung and Hsieh (1997) identified five strategies as accounting for 45 percent of the variation of hedge fund returns. They labeled them “trend following” one and two, “value,” “global/macro,” and “distressed securities.” Fung and Hsieh (2001 and 2004) advanced the concepts of rule-based replication building blocks they labeled “primitive trading strategies” applied to trend following, long-short equity, and credit arbitrage. Others added them for merger arbitrage, convertible arbitrage, and general equity and emerging markets funds. Thus diversified hedge fund portfolios could be described in terms of these “alternative beta” factors, the remainder being “alternative alpha.”
Jaeger (2008) estimated that with factor-based, rule-based, and distributional replication, beta can account for up to 90 percent of hedge fund returns. His book reviewed the entire spectrum of techniques. Roncalli and Weisang (2008) developed statistical filtering methods to address the issues of slow reactivity of replication to tactical reallocation and the inability to capture non-linear positions; they also proposed the core-satellite approach to overcoming the lack of access to the alpha of hedge funds. The core-satellite model stresses traditional long asset class allocation for the bulk of investment dollars, supplemented with satellite alpha-focused investments.
Hedge Fund Strategies
Hedge funds pursue a variety of investment strategies. Table 1 shows my classification of hedge funds, based not on the asset classes covered, but on the subjective criterion of how the relative value that the fund tries to unlock is pursued. Broadly, I group the funds into four blocks, from general bets on asset class groups, all the way down to technical mispricing.
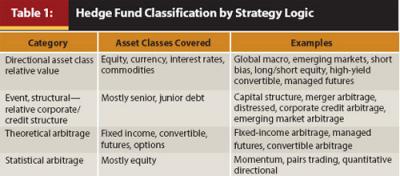
Let us delve into the classification of hedge funds presented in Table 1 with concrete examples. Each category’s common theme is where the manager’s alpha is coming from: picking asset classes and securities, expertise in credit and corporate events, superior option and futures pricing modeling, or sophisticated statistical modeling of the entirety of markets leading to frequently rebalanced trading schemes.
Directional Asset Class Arbitrage. The horizon is a few weeks to a year. We bet on some asset classes outperforming others, or some securities within an asset class outperforming others. We design a long-short, an overweight, or an open-ended carry trade. Examples include:
- 130/30 Long-Short Equity. The fund goes long 130 percent of the invested funds, using the leverage from shorting 30 percent of the invested funds.2 This is pursued by some mutual funds that try to compete with hedge funds.
- Long-Short Equity. This is an unconstrained variant of the 130/30. There is nothing stopping a hedge fund from using a much higher leverage and ratio of longs to shorts, or from using invested funds to create a short bias. We could describe this as 100/100 long/short. An extreme version is pairs trading.
- Short-Bias Fund. This is a long-short fund with more short than long. If we believe that the market overall is going down, we short more stock than we buy, that is, we pursue a 30/130 ratio or even 0/100. Using the invested cash as short-supporting margin provides automatic leverage.
- Global Macro. This is the long-short concept applied to the entirety of asset classes and often involving open carry (borrow cash to buy assets or short assets to lend cash, with no futures hedge). We use the invested cash to support margin buying and selling in the account. We go long on emerging market stocks and short U.S. stocks, or long on German bonds and short U.K. bonds. The positions have residual currency exposures; we can leave them unhedged or we can partially hedge them using currency swaps or forwards. A global macro fund can lever up by eschewing cash instruments in favor of futures or OTC derivatives. Buying German bond futures and shorting U.K. gilt futures might eat up less cash for margin than the same position in cash bonds. This need not be the case depending on the cash-and-carry calculation involving the repo financing cost/benefit on both sides.
Event and Structural Relative Corporate/Credit Arbitrage. There are two distinct strategies in this space: merger arbitrage and credit structure arbitrage. The first is a play on the prospects of a merger or a company breakup, with profit coming from the correct assessment of the probability of the corporate event. The second is a play on the relative value of equity, preferred, and debt in a company’s structure, the relative values of the different forms of debt, or the price of debt in the corporate bond market and CDS market.
- Merger Arbitrage. The stock of a target company goes up close to, but not all the way to, the tender price announced by the acquirer. Because the tender often involves an exchange of shares, the dollar price of the tender exchange ratio varies as the two stocks fluctuate. The difference between the full tender value of the target and the current price of the target after the announcement reflects the probability (and cost) of the merger going through. Hedge fund managers can buy the target and short the acquirer if they think the merger is likely at the current price ratio and the gap will close, or short the target and buy the acquirer if they think the merger will not happen or the ratio will change (in the tender terms or new acquirer).
- Credit (Structure) Arbitrage. This is a play on the relative seniority and pricing of the different categories of debt and equity in the corporate structure. We can use an option-theoretic approach to perform the relative pricing. If V~ is the total value of the company’s assets and K is the face value of the debt, then the equity value E is a call option on V~ with a strike price of K. The equity holders get the discounted, risk-neutral expected value of the excess of the company’s enterprise value over the face value of debt, or:
With assumptions about the volatility of the assets, we can value the equity given the market value of the debt, and vice versa. We use the put-call parity to break down the total enterprise value of the firm into equity plus debt:
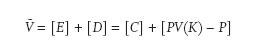
The value of the equity is the call on V~ with the strike K. The value of the debt is the present value of the strike minus the put on V~ with the strike K. The debt holders’ position is not simply PV(K). If the value of the enterprise falls below the face value of the debt, they will not get the full principal back (downgrade, default). Implicitly, they have written a put option on the value of the firm. We don’t know if the equity is undervalued or debt overvalued. We do know, however, that at higher volatility numbers, we get a greater undervaluation of equity given debt and overvaluation of debt given equity. We can zero in on a relative value “hedge” strategy. We short the debt (perhaps hedged with long Treasuries) and buy the equity, or the other way around.
This option-theoretic approach can be pushed further to value the different tranches of debt relative to each other. The yields-to-maturity on senior and subordinated imply certain probabilities of default and trade at spreads to Treasuries. Viewing the junior tranches as claims on the total value of the assets minus the senior debt, we can use the option theory to imply the strike prices and thus derive the relative value of the junior debt.
Theoretical Arbitrage. In this space, the logic is a decomposition of the value of a security into the sum of its pieces. In fixed income, coupon bonds are composed of principal and coupon strips. In hybrid asset classes, convertibles are packages of bullet bonds and long options to convert into equity. In managed futures, the cash-and-carry is used to put together a basis or convergence trade. One side is rich; the other is cheap. The glue is an option model or the cost of financing. The principle is synthetic replication. Examples include:
- Fixed-Income Arbitrage. This is most often posed as a rich/cheap yield curve pricing inefficiency, but the essence of the trade is always: long a package of cash flows and short a package of nearly/or identical cash flows with the residual risk being a forward interest rate, volatility, or swap spread. Examples: long strips/short coupons, long corporate-short Treasury, mortgage prepayment versus interest-rate changes, domestic versus international. In the on-the-run/off-the-run3 liquidity trade, if we think that the off-the-run, 29-year Treasury is very cheap (high yield) relative to the on-the-run, 30-year Treasury (low yield) and the relative pricing is going to persist, then we buy the 29-year and short the 30-year, including any special repo in the financing.
- Swap-Spread Arbitrage. We take a long or short position on the swap spread.4 If we think the swap spread for maturity t is going to narrow, we receive a fixed swap rate S (against floating Libor L~), we short the corresponding maturity Treasury yielding the rate T, and we earn the repo rate R~ in the margin account. We lock in the swap spread S – T against uncertain difference R~ – L~. If the swap spread narrows in the market, the locked-in difference has a positive PV. If we think the swap spread for maturity t is going to widen, we pay a fixed swap rate S (against floating Libor L~), and we buy the corresponding maturity Treasury yielding the rate T, financing the purchase at the repo rate R~ in the margin account. We lock in to pay the swap spread S – T against receiving the uncertain difference L~ – R~. If the swap spread widens in the market, then what we locked in to pay has a positive PV.
The strategy can also be executed using Eurodollar and bond futures.
- Yield-Curve Arbitrage. The strategies involve taking close substitutes, duration-matching longs with shorts, and forming butterflies or curve steepeners/flatteners.5 If we think the curve is too humped in the middle, we pursue a butterfly: buy the 5-year and short the 2-year and the 10-year Treasury or agency, all duration-matched to create a neutral trade on a parallel-rate move. If we think the curve is about to flatten/steepen, we go short/long on the short end and long/short the long end, again all duration-matched.
- Volatility Arbitrage. Two regularities in volatility products are often exploited. The first is that short-term volatilities tend to be higher than long-term volatilities. This is true in bond, caps, or swaption volatilities,6 often in equities and currencies. One potential explanation is mean reversion; another is fat tails relative to log-normal.7 The trade is similar to the butterfly or steepener trades in rates, but it is on the relative points on the volatility curve. The second regularity is that implied volatilities tend to be higher/lower than subsequent realized volatilities. This can be an artifact of the demand for the liquidity or convenience of risk insurance. The trade may be to go long on volatility and to delta hedge the directional exposure.
- Convertible Bond Arbitrage. The conversion option included in the bond may be theoretically (in an option model) underpriced. The arbitrage trade is to buy the bond, short the stock, and perhaps short a bullet bond on the same company. The riskier version, which involves general corporate spread risk, is to buy several convertibles and short Treasuries or futures to establish an aggregate hedge. The long convert/short bullet allows the hedger to acquire a cheap equity option on the company. The relative value is monetized by selling calls or shorting stock. The main risks are that the long term of the conversion option is mismatched with the short hedge and that the stripping of the conversion of the interest-rate risk is imperfect. There is also the interaction of the two. The conversion underpricing can be hard to monetize and can persist.
- Managed Futures. The strategies rely on a blend of theory and technical analysis. The theory is the fair valuation of the futures, muddied by contango/backwardation8 exceptions. The theory is then superimposed on:
- Trend Following: moving average and similar indicators signal the start or end of a short-term trend—this is the most popular strategy in managed futures
- Reversals: counter-trend trades involve identifying trend reversals
- Spread Trading: when implied volatility is high, write out-of-the-money calls and puts and take a residual position in futures to profit from range trading—the main risk for an investor here is to define the risk properly for funds that have experienced positive returns in the past
- Basis Trading:9 spot and subsequent expiry futures traded against each other based on the cost-of-carry and convergence criteria
Statistical Arbitrage. Statistical arbitrage is driven by large computerized models that factorize the universe of securities into systematic (portfolio) and residual (security-specific) risk. The trade signals are not at the market/sector level, but at the individual security level. Statistical arbitrage cannot be implemented by a small, unsophisticated player. It involves momentum or contrarian long/short rebalancing of the entire cross-section of securities at high frequency, with net index hedging.
Suppose we want to construct a short-term momentum strategy for U.S. stocks. We believe in first-order autocorrelation. We apply a three- or four-factor index model to separate out the systematic (beta) factors from “pure” momentum “residuals.” The index model also identifies the hedge to stay market neutral. The index model we choose may be an academic one like Fama and French (1992) or Carhart (1997). We find the factor loadings (betas) for all the stocks we are going to trade and construct the residuals of the realized stock returns minus index model returns. The sums of the loadings on each factor identify the market neutral hedges with respect to the factors. We dig into the residual data to discover momentum or reversal signals. Suppose that in applying an autoregressive-moving average ARMA (2,1) model we find statistical significance in the AR terms.10 These will define the strength of the momentum buy/sell signals. We rebalance daily, but our “signal” is composed of the return realizations over the previous two days. We buy stocks with long momentum signals; we short stocks with sell momentum signals. On any given day, some stocks get included in the long portfolio, and some get included in the short portfolio. From the individual exposures to the index factors, we compute the net hedge to eliminate the directional risk (zero beta). The expected net excess return we hope to generate from all the longs and shorts over time is our model alpha.
The statistical approach can be applied to yield curve points, currencies, and commodities in which we can exploit inherent correlation of related assets. It is, however, distinct from the theoretical arbitrage. Here we rely on historical relationships (historical “mispricing”). There we relied on theoretical no-arbitrage bounds of frictionless markets applied to real markets (relative value mispricing).
Portable Alpha and Market-Neutral Plays
It is a good idea for a pension fund manager, endowment manager, or financial adviser to separate passive parts of the portfolio from the active ones. This is the core-satellite model. The core asset class allocation decisions are made first at the top level. Then the residual investment dollars are allocated to individual managers. The passive management and active management certainly require different sets of skills. This separation is not always easy to achieve. Actively managed portfolios mix market (beta) exposure with security selection (alpha). This is where the idea of alpha transfer comes in. In an alpha transfer, a hedge fund design makes a pure portable alpha play by hedging out the beta exposure(s). Let us consider the following example.
A pension fund wants to allocate 5 percent of its investment dollars to an alpha fund manager specializing in “arbitraging” the underpricing of technological and pharmaceutical stocks. The manager’s scheme does not work for other sectors or overpricing. The pension fund does not want the manager to simply buy the underpriced stocks as that would also expose it to the market risk of U.S. equities. The underpriced stocks waiting to correct up could sink if the market overall corrects down. The fund offers a portable alpha solution. It hedges its overall exposure to U.S equities with short S&P 500 futures (using the sector beta as the hedge ratio) or more cleanly (no beta correction) with tech-sector ETFs. This way, the returns of the fund reflect the pure security selection alpha over the designated bogey, and the pension fund can manage its asset allocation independently of the security selection. It can independently decide to increase/reduce the allocation to U.S. equities while still retaining the same 5 percent in the alpha fund. The process of separating the asset class exposure from specific risk plays is the alpha transfer.
Alpha or Beta?
The biggest attraction and risk of a hedge fund is an almost unlimited discretion afforded the fund manager. This engenders two negative aspects of hedge fund investing—style drift and clustering. Because hedge funds are unregulated and their prospectuses are very vague, there is nothing stopping the manager from pursuing currency ideas one year and fixed income or equity ideas the next, or going from technical mispricing strategies to event-driven ones. This is referred to as style drift. The investor here has to truly believe in the manager’s skill (alpha). Also, it has been well documented that at any given moment many managers pursue the same ideas and may be on the same side of a trade. This is clustering as a result of exposure inertia.
Often, hedge fund managers hold illiquid securities and cannot get out of their strategies. In an influential study by Hasanhodzic and Lo (2007), the authors find significant serial correlation in hedge fund returns. They suggest that hedge fund outperformance may not be coming from managers’ investment acumen, but may be reward for illiquidity to which public market investors cannot gain exposure. The Sharpe ratios may be artificially lowered as the reported returns are smoothed in the process of marking to market illiquid holdings, resulting in artificially low computed standard deviations.
Two more issues deserve attention. First, the number of funds launched and liquidated each year is very large. For example, in 2008 about 1,500 funds were liquidated and 500 launched; in 2009 about 1,000 were liquidated and more than 500 new ones launched.11 Although their average return may be higher than a passive index strategy, extreme positive and negative surprises abound. How would an investor know in advance which fund to choose in order to be at, or above, average? Second, this survivorship bias implies that each year many failed funds are excluded from the average calculation. We have no way of knowing what the average would be if we could include failures. Hedge fund investors face the lack of transparency, high-net-worth requirements, lack of liquidity, and being shut out of many funds with good records. Most surveys cite high fees and illiquidity as topping the investors’ concern list.
The research into hedge funds’ performance has documented a very high correlation of their aggregate returns with passive index strategies (with the exception of some long/short and most inflation-focused funds). In several cases, the correlation to the S&P 500 Index exceeds 0.7. Although super-active macro funds get a lot of press, the reality is that most hedge funds pursue more benign equity and fixed-income strategies, and their positions persist sometimes over many months. If the correlation to the stock and bond indices is that high, could it be that hedge fund investors get no superior returns, get no benefits of diversification, but suffer high fees? This then begs the question of whether the returns can be synthetically replicated by exposure to a number of macro factors.
This question has already been partially answered. The Goldman Sachs Absolute Tracker Index is a mostly linear factor model. The research revolution started by Fung and Hsieh (1997 and subsequent) has led to the development of the entire rule-based replication industry. As surveyed by Jaeger (2008), the economic factors, coupled with customized strategy-by-strategy replicating trading rules and enhanced with distributional replication (for strategies not easily described by tight rules), can capture up to 90 percent of the aggregate hedge fund returns. Although hedge funds claim economic and technical sophistication, or alpha, it is likely that the return on a group of similar strategy funds, or even each individual fund, can be attributed (with today’s replication technology) to the exposure to economic factor strategies. What if hedge fund strategies became more transparent, and their returns could then be shown to be decomposed into a set of factors, and factor loadings easily computed? Perhaps all that alpha is just noisy, multifactor beta? It is hard not to at least acknowledge the possibility that what we have found about mutual funds over the last 30 years—that two-thirds of active mutual fund managers underperform the index net of fees—could be true of hedge funds, too; we just don’t know it yet.
Strategy Indices and Replication
Let us explore the question of whether hedge fund strategies can be replicated cheaply. We don’t know for sure, but in the last few years, a new industry has come to life: creating strategy indices and offering those indices in the form of cheap passive funds. “Passive” comes here with a caveat: the replication strategy may be intense, requiring ultra-frequent rebalancing and multiple derivative instruments, but it is algorithmic and precisely defined by the index creator. The principal players in this business are Credit Suisse, State Street Global Advisors, and Goldman Sachs on the institutional/wealth management side, and IndexIQ, WisdomTree, and AdvisorShares on the retail side. The business is slowly moving from the institutional space to retail.
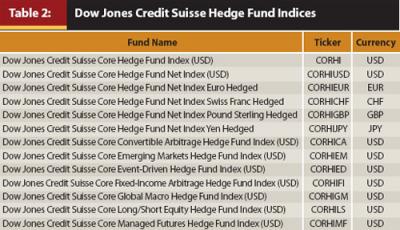
There are two ways of tracking the performance of individual hedge fund strategies. First is the asset-weighted index of liquid, investable hedge funds. In April 2011, Dow Jones launched a series of Credit Suisse hedge fund indices12 normalized to 100 as of 12/31/2010. Table 2 shows the list of the indices, their tickers, and their currency of denomination.
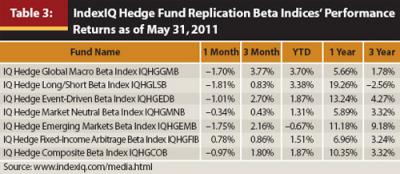
Another way of measuring performance is to track indices of proprietary replicating “primitive trading strategies.” Table 3 shows the list of replicating passive indices and their performance offered by IndexIQ as of May 31, 2011.
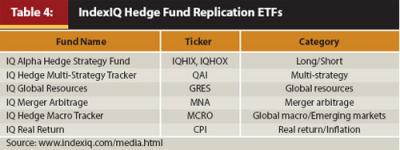
To track the indices listed in Table 3, IndexIQ offers several passive replication ETFs. The ETFs, their tickers, and their strategy categories are listed in Table 4.
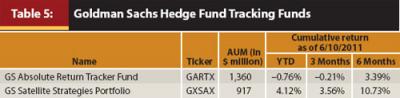
Goldman Sachs Asset Management publishes the GS Absolute Return Tracker Index and offers two related passive tracking funds. The first tries to replicate the index; the second tries to capture a basket of satellite strategies. The two funds, their tickers, their assets under management, and their returns as of June 10, 2011, are listed in Table 5.
In the academic literature, the replication methodology has been divided into factor-based, rule-based, and distributional, reflecting the evolution of thought from simple aggregate return factorization, to individual strategy “indexation,” to strategy return distribution analysis. In the industry, a more appropriate classification of hedge fund replication would be into two categories: semi-passive “indexing,” or regression models estimating factor loadings on indices and factors; and active formulaic replication of current fads and targets.
The first is technically clean. We pose a regression model of hedge fund returns on a set of index factors, look for significance, and estimate factor loadings (betas). The main problem is factor identification; the second may be inherent non-linearities. Although this may seem impossible at first, this has been done in many cases. Many strategies have been digested into canonical “primitive trading strategies.” As an example, let us see where a little bit of clever thinking can lead. Can other people’s aggregate long/short selections be deduced from the exchange-reported short interest as a percentage of total float of a stock? Can a put-to-call open interest ratio tell us anything? If so, we have the start of a long/short replication index factor. Is liquidity risk related to the change in the implied volatilities (fear)? If so, we gain exposure to it through volatility futures, options, or swaps. Can inflation be stripped of nominal and real rate Treasuries? If so, we can create real rate of return vehicles. Can merger candidates be identified by the relative price/earnings or free cash flow within the industry, tender premium offered, etc.? If so, perhaps a merger arbitrage index can also be modeled. Do commodity trend followers use the same technical indicators? Then we have another “index.”
The second, harder, approach to hedge fund replication involves active research into the current trade ideas and copying them. The objective is not to create a replication index and a passive fund, but an active fund with low fees and high liquidity. The replicator focuses here on observing the clustering and the timing of the actual hedge fund positions, then replicating the exposure to various factors without knowing the exact purpose of the strategy. Some strategy styles, like market-neutral or merger-driven ones, may be impossible to replicate this way. In market-neutral strategies with close substitutes, the arbitrage is tight, and the substitutes may be difficult to distinguish by the replicator. In merger arbitrage, the replicator may be late to the game. However, because many global macro or credit arbitrage strategies take several weeks or months to establish and unwind, the clustering of the trades as a result of this exposure inertia may be easily detectable.
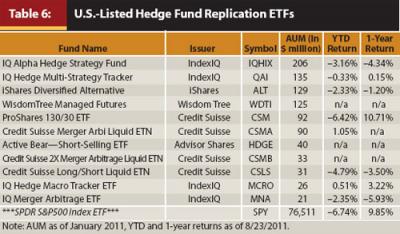
Table 6 shows hedge fund replicating vehicles available to U.S. retail investors in an ETF form. According to etfdb.com and hedgefundetfs.com, as of January 2011, there were only 11 hedge fund tracking/replicating ETFs13 offered to U.S. investors (three in ETN form). Table 6 shows the 11 funds, their issuing companies, tickers, and assets under management in millions of dollars, all sorted by market cap.
Note that the assets under management are relatively small compared with both the institutional/wealthy individual-oriented GS Absolute Return Tracker fund and with fundamentally indexed ETFs (equal-weighted or dividend-weighted U.S. equity baskets), such as Rydex S&P Equal Weight (RSP) with $3.34 billion in assets and iShares Dow Jones Select Dividend (DVY) with $6.38 billion in assets.
Conclusion: Ask Yourself Why You Want a Hedge Fund
Picking a hedge fund is tricky. If we know and trust the manager’s skill, the decision is simple: bet on his/her superior alpha. If we don’t know the manager(s) and seek exposure to the uncorrelated strategies pursued by hedge funds, then we have choices to make. Some strategies—for example, market neutral, merger arbitrage, and statistical/theoretical commodity—cannot be easily replicated. Some strategies can, perhaps not fund by fund, but in aggregate. Some are replicated with “traditional beta” (systematic) and “alternative beta” (primitive strategy index) factorization; some are replicated through an active search for clustering. The replicating indices and corresponding fund vehicles offer transparency, low cost, and liquidity. They also minimize Madoff-like fraud exposure.
Some replicating strategies have had low correlation to passive stock indices. These include long/short, certain alternative beta funds, statistical arbitrage, and inflation funds. Some have exhibited high historical correlations to passive indices. These include merger arbitrage, emerging markets, multi-strategy, and certain alternative beta funds. The indices they pursue are not perfect representations of actual hedge fund returns. And, although the funds may match the indices with mathematical blindness, they are not index funds. They may not be replicating any systematic factors at all.
The advantage of the replication vehicles is daily liquidity and low cost. One disadvantage is tracking error (replication is imperfect, and what you are replicating is not well defined). Another even bigger disadvantage is that these vehicles only work in aggregate. Like funds of funds, they track an overall performance of the hedge fund class or a narrower strategy class. They cannot replicate an individual fund. Thus, they do not provide access to managerial alpha, which is usually the original motive to invest in a hedge fund.
For small investors, the issue I think is this: If you take the core-satellite approach or the traditional asset allocation/security selection approach, you want to construct a core portfolio consisting of a broad exposure to equities, fixed income, commodities, and real estate, with geographic and sector diversification. Then you want to gain some exposure to the security selection alpha. You do not get that through the replication vehicles. Instead, you get exposure to alternative (strategy) betas that themselves may hide exposure to traditional (index) betas. If you want alpha for some part of your portfolio, you need to be in an active fund. If you want alpha but cannot afford to get into a hedge fund, a replicating ETF will be cheaper, but will not give you what you want.
Endnotes
- Figure 1 and some parts of this article are adapted from Chapter 12 of my textbook Financial Engineering and Arbitrage in Financial Markets (Hoboken, NJ: John Wiley, 2011). I would also like to acknowledge the useful insights gained by attending free webinars offered by IndexUniverse.com. Any errors are, of course, mine.
- Minus the financing “haircut” and subject to margin rules.
- Strips are zero-coupon or discount bonds. In the Treasury market, “on the runs” are the bonds currently closest to 2-, 3-, 5-, 10-, and 30-year maturities. They are the most liquid. The rest are called “off the runs.” Purchases of Treasury bonds are financed through collateralized arrangements called “repos.”
- The swap spread is the difference in the yields of interest-rate swaps (reflecting the credit quality of banks and dealers) and Treasuries (risk-free). The swap spread can be interpreted as the price of risk (or fear) and varies a lot reflecting economic conditions.
- A “butterfly” is a position in three bonds: buy the short-maturity and long-maturity bonds and short-sell the medium maturity bond, or vice versa (all duration-matched to achieve a zero overall exposure to an up or down parallel interest-rate shift. A “flattener” is a short position in the short-maturity bond and a long position in the long-maturity bond (duration-matched). The strategy benefits when the yield curve flattens. A “steepener” has the positions reversed.
- Caps are options on short-term rates (Libor). Swaptions are options on long-term rates.
- A “fat-tailed” distribution is one with many extreme low and high outcomes.
- “Contango” and “backwardation” refer to the pattern of futures prices sorted by the increasing expiry date. Contango is an increasing pattern in prices. Backwardation is a decreasing pattern of prices. For trading purposes, both terms are defined relative to the fair value—that is, adjusted for the cost of carry (financing, storage, and convenience).
- “Basis” is the difference between the futures price and the spot price.
- Positive AR coefficients signal momentum; negative ones are contrarian.
- See “Hedge Funds Bounce Back,” Wall Street Journal, April 18, 2011, on losses and redemptions suffered by hedge funds in 2008–2009.
- Previously known as Credit Suisse/Tremont indices.
- In Table 6, I also include IQ Alpha Hedge Fund Strategy Fund (IQHIX), not listed by Etfdb, but exclude IQ Real Return ETF (CPI) and IQ Global Resources (GRES) as not purely hedge fund replicating ETFs. As of July 2011, the databases listed 35 “alternative funds,” but many (including 2x-, 3x-leveraged index or VIX-based) were mis-categorized. I exclude all those and funds with less than $20 million in assets under management.
References
Agarwal, Vikas, and Narayan Y. Naik. 2000. “Multiperiod Performance Persistence Analysis of Hedge Funds.” Journal of Financial and Quantitative Analysis 35, 3: 327–342.
Agarwal, Vikas, Naveen D. Daniel, and Narayan Y. Naik. 2009. “Role of Managerial Incentives and Discretion in Hedge Fund Performance.” Journal of Finance 64, 5: 2221–2256.
Amenc, Noël, Lionel Martellini, Jean-Christophe Meyfredi, and Volker Ziemann. 2010. “Passive Hedge Fund Replication: Beyond the Linear Case.” European Financial Management 16, 2: 191–210.
Arnott, Rob, and John West. 2008. “Liquid Alternatives: More than Hedge Funds.” IndexUniverse.com.
Bollen, Nicolas P. B., and Robert E. Whaley. 2009. “Hedge Fund Risk Dynamics: Implications for Performance Appraisal.” Journal of Finance 64, 2: 985–1035.
Bollen, Nicolas P. B., and Veronika K. Pool. 2009. “Do Hedge Fund Managers Misreport Returns? Evidence from the Pooled Distribution.” Journal of Finance 64, 5: 2257–2288.
Boyson, Nicole M. 2008. “Hedge Fund Performance Persistence: A New Approach.” Financial Analysts Journal 64, 6: 27–44.
Brooks, Chris, Clare Andrew, and Nick Motson. 2008. “The Gross Truth About Hedge Fund Performance and Risk: The Impact of Incentive Fees.” Journal of Financial Transformation 24: 33–42.
Brown, S. J., W. N. Goetzmann, and R. G. Ibbotson. 1999. “Offshore Hedge Funds: Survival and Performance, 1989–1995.” Journal of Business 72, 1: 91–117.
Carhart, M. M. 1997. “On Persistence in Mutual Fund Performance.” Journal of Finance 52: 57–82.
Eling, Martin. 2009. “Does Hedge Fund Performance Persist? Overview and New Empirical Evidence.” European Financial Management 15, 2: 362–401.
Fama, Eugene F., and Kenneth R. French. 1992. “The Cross-Section of Expected Stock Returns.” Journal of Finance 47, 2: 427–465.
Fung, William, and David A. Hsieh. 1997. “Empirical Characteristics of Dynamic Trading Strategies: The Case of Hedge Funds.” Review of Financial Studies 10, 2: 275–302.
Fung, William, and David A. Hsieh. 2001. “The Risk in Hedge Fund Strategies: Theory and Evidence from Trend Followers.” Review of Financial Studies 14, 2: 313–341.
Fung, William, and David A. Hsieh. 2004. “The Risk in Hedge Fund Strategies: Theory and Evidence from Long/Short Equity Funds.” Working paper. Revised version in Journal of Empirical Finance in 2011.
Fung, William, and David A. Hsieh. 2007. “Hedge Fund Replication Strategies: Implications for Investors and Regulators. Financial Stability Review 10: 55–66.
Fung, William, and David A. Hsieh. 2009. “Perspectives: Measurement Biases in Hedge Fund Performance Data—An Update.” Financial Analysts Journal 65, 3.
Griffin, John M., and Jin Xu. 2009. “How Smart Are the Smart Guys? A Unique View from Hedge Fund Stock Holdings.” Review of Financial Studies 22, 7: 2531–2570.
Hasanhodzic, Jasmina, and Andrew W. Lo. 2007. “Can Hedge Fund Returns Be Replicated? The Linear Case.” Journal of Investment Management 5: 5–45.
Jaeger, Lars. 2008. Alternative Beta Strategies and Hedge Fund Replication. Hoboken, NJ: John Wiley.
Roncalli, Thierry, and Guillaume Weisang. 2009. “Tracking Problems, Hedge Fund Replication, and Alternative Beta.” SSRN Working Paper.
Sadka, Ronnie. 2010. “Liquidity Risk and the Cross-Section of Hedge Fund Returns.” Journal of Financial Economics 98: 54–71.
Takahashi, Akihito, and Kyo Yamamoto. 2008. “Hedge Fund Replication.” Center for Advanced Research in Finance Working Paper CARF-F-137.