Journal of Financial Planning; October 2014
Financial advisers frequently find themselves in situations where traditional safe withdrawal rates do not apply. For example, what is a safe withdrawal rate for an 80-year-old client? What about for a client with Social Security or defined benefit pension entitlement that has not yet commenced? This article provides withdrawal rates for a variety of scenarios from which advisers can select based on the desired probability of success. And a new retirement income planning technique is presented that uses these withdrawal rates, eliminating the need to perform complex Monte Carlo simulations for each client.
3 Ways to Think about Safe Withdrawal Rates
Traditional safe withdrawal rates. Two decades have passed since the original safe withdrawal rate studies appeared (most notably, Bill Bengen’s seminal article, “Determining Withdrawal Rates Using Historical Data,” published in the October 1994 issue of this Journal). During the first decade, studies assumed portfolio withdrawals would increase each year in lockstep with inflation, regardless of portfolio performance. I refer to this approach as traditional safe withdrawal rates (TSWRs).
Using historical data from 1926 to 2013 and running Monte Carlo simulations of 100,000 iterations each with normal distributions1, showed that the probability of success over 30 years of an initial withdrawal rate of 4 percent with future increases equal to inflation thereafter is 95 percent. Increasing the initial withdrawal rate to 5 percent reduces the success probability to 82 percent. An initial withdrawal rate of 6 percent has a success probability of 61 percent. Success is defined as making it to the end of the retirement duration with at least one dollar in the portfolio.
The Target Percentage Adjustment. During the most recent decade, researchers challenged the notion of withdrawal amounts that automatically track inflation regardless of portfolio performance. For example, my January 2013 Journal article, “Achieving a Higher Safe Withdrawal Rate with the Target Percentage Adjustment,” demonstrated that initial withdrawal rates 50 percent higher than traditional safe withdrawal rates can be achieved with the same probability of success by using a dynamic withdrawal strategy called the Target Percentage Adjustment (TPA).
The TPA approach establishes a target withdrawal rate for each year of retirement, and each year, portfolio performance is measured by comparing the actual withdrawal rate to the target. If the actual withdrawal rate exceeds the target percentage, the target percentage test is failed and no increase in the withdrawal amount is taken in that year—it remains the same as the prior year. If the actual withdrawal rate is less than the target percentage, the target percentage test is passed, and the withdrawal amount for that year is equal to the prior year withdrawal amount increased by inflation.
The probability of success over 30 years of an initial withdrawal rate of 6 percent using TPA is 94 percent. Increasing the initial withdrawal rate to 7 percent reduces the success probability to 82 percent. An initial withdrawal rate of 8 percent has a success probability of 61 percent. These probabilities of success are significantly more favorable than TSWRs; however, these higher initial withdrawal rates come with the risk of loss of future purchasing power by virtue of potential skipped inflation increases.
TPA with 3 percent maximum. Proposed here as a middle ground between traditional safe withdrawal rates and the Target Percentage Adjustment, is the Target Percentage Adjustment with 3 percent maximum (TPA 3 percent). This dynamic withdrawal technique is the same as TPA, except when the target percentage test is failed, the new withdrawal amount is the greater of the prior year withdrawal amount or 97 percent of the prior year withdrawal amount after the inflation increase.
Using TPA 3 percent, the probability of success over 30 years of an initial withdrawal rate of 5 percent is 95 percent. Increasing the initial withdrawal rate to 6 percent reduces the success probability to 83 percent. An initial withdrawal rate of 7 percent has a success probability of 62 percent. (See appendix below).
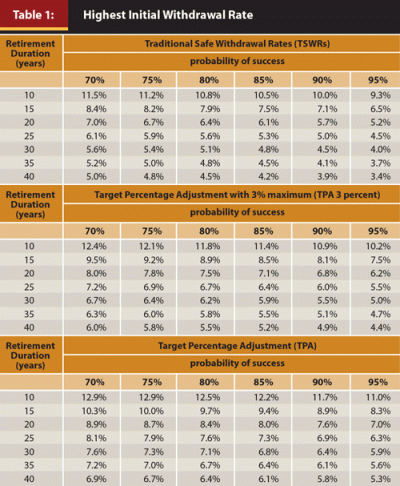
Table 1 shows highest initial withdrawal rates with success probabilities of 70 to 95 percent for retirement durations from 10 to 40 years in five-year increments under these three methods. Using this table, advisers can easily look up the desired withdrawal rate based on their client’s expected retirement duration, risk tolerance (probability of success), and willingness to forego future inflation increases when portfolio performance is less than anticipated.

Communicating Withdrawal Rates
Now that we know the probabilities, the challenge is to communicate these results to clients. I have found that an effective tool for this purpose is a table assessing the probability of success of various ranges of withdrawal rates.
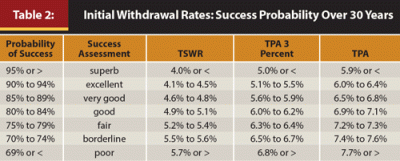
For example, let’s say you determine that a 95 percent or better probability of success is “superb,” 90 to 94 percent is “excellent,” 85 to 89 percent is “very good,” 80 to 84 percent is “good,” 75 to 79 percent is “fair,” 70 to 74 percent is “borderline,” and 69 percent or less is “poor.” Based on this assessment of risk, Table 2 shows how to present withdrawal rate targets to clients based on each of the three methods discussed in this article (TSWR, TPA 3 percent, and TPA). This presentation simplifies a complex topic into a form that, in my experience, clients can readily understand. Table 2 was constructed using the data from Table 1 assuming a 30-year retirement. Tables for other retirement durations can be similarly constructed.

Once the withdrawal rate targets are selected, we can begin the retirement income planning process. The following case studies illustrate the technique assuming an anticipated 30-year retirement.
Case Study 1: Already Retired
Hank and Donna are each 63 years old and retired. Hank’s Social Security is $2,000 a month, and Donna’s is $1,000 a month. Hank receives a defined benefit pension of $1,000 a month (all benefits are currently in pay status). Their portfolio is $650,000, and their annual living expenses including income taxes are $85,000.
They receive a total annual defined benefit retirement income of $48,000 (12 multiplied by the sum of $2,000 + $1,000 + $1,000). Therefore, $37,000 ($85,000 – $48,000) of their annual living expenses must be withdrawn from their portfolio. This amount represents an annual withdrawal of 5.7 percent of their portfolio per year ($37,000 ÷ $650,000).
Whether 5.7 percent is considered a safe withdrawal rate depends upon whether or not the clients intend to increase their portfolio withdrawals each year in the future to keep up with inflation. If they do, then the TSWRs lookup in Table 2 indicates that the probability of their portfolio surviving for 30 years is poor. However, if they are willing to skip inflation increases in years when their withdrawal amount fails the target percentage test, then the TPA lookup in Table 2 indicates the chances of their portfolio surviving 30 years are superb. If they intend to follow the TPA 3 percent approach, their prospects are very good.
Case Study 2: When Can I Retire?
Joe, 62, is married to Jane, also 62. Joe is employed and the couple want to know when Joe can retire with confidence that they will not outlive their $650,000 portfolio. Annual living expenses including income taxes in retirement are expected to be $80,000. They both plan on starting Social Security when Joe retires. They expect to increase their portfolio withdrawals by inflation each year in the future.
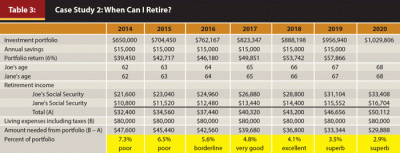
Table 3 shows seven alternative scenarios of Joe retiring this year or each of the next six years. The calculation methodology for each column in Table 2 is the same for Case Study 1. The six-year portfolio projection shown in the first three lines is a simple roll forward calculation assuming annual retirement savings of $15,000 and a 6 percent portfolio return.

The bottom two rows of Table 3 indicate Joe’s retirement date prospects. Note that their living expenses are not assumed to increase during the projection period, but this modification can easily be made as you will see in the next case study.
To improve the probability of not outliving their portfolio, the usual planning options apply to Joe and Jane (as well as Hank and Donna in Case Study 1), including lowering their living expenses and/or income taxes and adjusting their portfolio.
Case Study 3: Pivot Age
Bill is age 60 and employed. Mary is age 58. Bill’s Social Security benefit payable at age 62 is $2,000 a month. Mary’s Social Security benefit payable at age 62 is $1,000 a month. Bill and Mary would like to start Social Security benefits as soon as possible after Bill’s retirement. Bill has a defined benefit pension of $1,000 a month beginning at age 65 with no early commencement option. They currently save $15,000 per year for retirement and expect to increase that amount by 2 percent per year in the future. Their portfolio is $650,000, and annual living expenses including income taxes in retirement are expected to be $80,000, which they assume will increase by 2 percent per year. They expect to increase their portfolio withdrawals by inflation each year in the future. Bill and Mary want to know when they can retire safely.
What makes their situation different from the first two case studies is that all of their defined benefit retirement income does not commence until five years from now when Bill’s pension begins. Although we can calculate their withdrawal rate prior to the commencement of their defined benefit retirement income, we cannot use this metric to compare to the various tables presented in this article to determine their probability of success. We need to project their portfolio to the first date on which all of their defined benefit retirement income can or will commence in order to use the withdrawal rates presented here. I call this age their pivot age.
Imagine a five-year projection of Bill and Mary’s portfolio, assuming Bill retires today (see appendix) indicates an 8.6 percent withdrawal rate at their pivot ages in 2019. This projection assumes that for each of the next five years, the couple will withdraw from their portfolio their living expenses less Social Security. An 8.6 percent withdrawal rate is not sustainable; Bill and Mary need to look at retiring at a later date. (See appendix below).
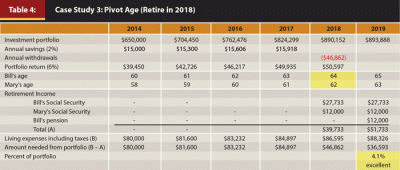
However, as shown in Table 4, if Bill works until age 64 and the couple continues to save toward retirement, they can retire safely in 2018. In 2019, their portfolio at their pivot ages (65 for Bill and 63 for Mary) is expected to be $893,888. After receiving $51,733 in defined benefit retirement income, they will need to withdraw $36,593 per year to pay the remaining portion of their projected $88,326 annual living expenses. This withdrawal amount is projected to be 4.1 percent of their portfolio, which is excellent.

If Bill and Mary’s portfolio today is $350,000 instead of $650,000, using the same projection methodology, we anticipate that if Bill retires at age 64, the couple’s portfolio withdrawal rate will be 7.4 percent at their pivot ages. Because this withdrawal rate is not likely to sustain their portfolio for a 30-year retirement, we need to evaluate the feasibility of retiring later. By illustrating five scenarios of retirement at the beginning of years 2019, 2020, 2021, 2022, and 2023, (see the online appendix) the projection indicates that Bill and Mary will probably not be able to safely retire until 2021.
Conclusion
By using lookup tables of safe withdrawal rates, the need to perform complex and cumbersome Monte Carlo simulations is eliminated. I recommend the analysis presented in this article be updated annually and in the event of significant life changes, including retirement or death of a spouse.
I have been using lookup tables for two years, and client response has been very favorable. This simple technique results in a one-page tabular display that clients can easily understand. Better client understanding results in better client buy in, which in turn results in better client compliance to the retirement plan, more client empowerment, and more overall satisfaction with the financial planning process.
Clients are no longer overwhelmed and baffled by pages and pages of statistical data. They look at one-page; they get it; they accept it; and we move on to discuss other topics knowing that their most pressing concern has been addressed.
CLICK HERE FOR ONLINE APPENDIX
David M. Zolt, CFP®, EA, ASA, MAAA, is a comprehensive, fee-only financial planner and president of Westlake Advisors, a registered investment adviser in Westlake, Ohio. He is the developer of The Retirement Planner software (www.RetireSoft.com). Contact him HERE.
Endnotes
- The model portfolio assumes 40 percent large-cap stocks, 10 percent small-cap stocks, and 50 percent intermediate-term government bonds with annual rebalancing. The allocation between large-cap and small-cap was selected to simulate the total U.S. stock market. Historical 1926 to 2013 data were taken from the Ibbotson® SBBI® Classic Yearbook. Monte Carlo simulations of 100,000 iterations each with normal distributions were performed using @RISK, an Excel add-in. Note that all withdrawal rate tables in the article are based on a 50/50 stock/bond allocation. Additional withdrawal rate tables based on five different asset allocations can be found at
www.RetireSoft.com/WithdrawalRates.