Journal of Financial Planning: April 2020
Executive Summary
- American families are leaving an estimated $237 billion on the table by not investing their college savings in 529 plans under normal market conditions. Under adverse market conditions, the missed opportunity is $33 billion.
- Under normal market conditions, the primary benefit for most families from using a 529 plan is not its tax advantages; it is the fact that it encourages investing instead of using a savings account.
- Middle- and upper-middle-class families stand to benefit the most from increased adoption of 529 plans (and other investing vehicles). The average family saving for college would see a benefit of $4,044 per child.
- More people would use 529 plans if they were explained effectively. A proof of concept randomized control trial was conducted to help overcome information overload and quantify the costs of alternative choices, and it showed a significant increase in planned 529 contributions versus the control case.
- Financial planners at any level can adopt a new form of low-cost visual intervention focused on quantifying the financial benefits of 529s against other vehicles currently used for college savings.
Michael Leung is a behavioral product manager at Morningstar, focusing on improving investor outcomes and success through software development. Leung holds a bachelor’s degree in history and East Asian studies and a minor in economics from Wesleyan University.
Steve Wendel, Ph.D., is the head of behavioral science at Morningstar, where his team conducts original research to help investors and advisers overcome common behavioral obstacles. He is the author of two books on applied behavioral science and product design.
Editor’s note: This research was presented in the Journal of Financial Planning/Academy of Financial Services research track at the 2019 FPA Annual Conference in Minneapolis, where financial planners and academics provided feedback and suggestions.
American families save a considerable amount of money to fund their children’s college educations: as of 2018, they had accumulated an estimated trillion dollars in savings for college.1 In doing so, they sacrifice purchases and their standard of living in the short term to give their children a better quality of life in the long term.
According to research by student loan provider Sallie Mae, much of the money that families save sits in checking or low-interest savings accounts for years. Roughly half of college savings is invested, and approximately one-third of that is invested in special accounts that provide tax benefits to subsidize college savings.2 A variety of accounts are available to parents saving for college, but the 529 plan dominates with the majority of assets. However, 529s are still only used by roughly one out of every six families with children.3
This paper seeks to address two questions related to college education savings and 529s. First, what is the cost that parents pay by not using a tax-advantaged 529 account when saving for college? Second, what can financial planners do to address this challenge?
In the first study, a nationally representative sample of American households from the 2016 Survey of Consumer Finances was used to calculate what would happen if every household saving for college used 529s instead of other types of accounts. In the second study, a range of interventions to potentially increase household college saving allocations to 529s was tested.
The focus of this paper is on the use of 529s for college savings—their intended purpose before the 2017 Tax Cuts and Jobs Act (TCJA) broadened the allowable purposes of 529s to include K-12 education. The use of 529s to cover K-12 education is a newer development, with little data about its use for that purpose and is not covered here.
Current State of College Savings
Among the over 38 million households in the United States with children under 18,4 over half (56 percent) are saving for college, according to the 2018 Sallie Mae report, “How America Saves for College.” Their savings, however, represent only a small portion of the total cost of college. For the average family, savings provide 21 percent of net college costs; the bulk comes from borrowing.5
The challenge for many parents is simple: how to borrow less and still pay for college. 529 plans provide a vehicle for families to do that, yet they are used by a small fraction of parents. Other education-focused savings vehicles, including Coverdell education saving accounts and prepaid tuition plans, are used by even fewer parents.6
Benefits and Risks of 529s
Previous research has discussed the advantages and disadvantages of 529 plans for different populations (Sherraden 2009; Clancy, Orszag, and Sherraden 2004). While imperfect investment vehicles, 529s offer a platform that allows states to provide greater access to college for low- to moderate-income families.
529s provide two main sources of benefits to users: tax advantages and investment advantages. 529s are not usually subject to capital gains tax on investment earnings—which means they can provide a significantly higher net return to individuals than a normal investment account.7 Many states also offer state income tax incentives for 529 contributions. Just over half of the U.S. population can decrease their state tax bill by contributing to a 529.8
In addition, 529s are primarily investment vehicles, and by moving one’s college savings to a 529, the funds typically can grow at a faster rate of return than in a savings account. That benefit is not unique to 529s—but it represents an improvement over savings accounts, especially when those investments can grow tax-free.
529s are far from perfect however, and the tradeoffs can be complex and difficult to calculate. Those tradeoffs come in two primary forms: inflexibility and investment risk. 529s are supposed to be used for qualified educational expenses—tuition, fees, books, supplies, and room and board. As of 2018, tuition for private K-12 schooling also qualifies. If the money is used for non-qualified purposes, however, the earnings portion of the non-qualified 529 plan distribution is subjected to a 10 percent penalty (California imposes an additional 2.5 percent state penalty tax).9 Moreover, due to liquidity needs, parents may prefer cash for their basic day-to-day needs or unforeseen costs—hence, their reluctance to “lock up” their money in 529s. Nevertheless, the accounts can be repurposed for a different person than originally intended—so if one child does not need the funds, they can be reallocated to a different child, or even to the parent’s continuing education.
As investment accounts, 529s can lose value when markets are down. Many 529 plans offer a glide path that moves the investments from stocks into less volatile bonds as the child’s date of college approaches—which can decrease, but not remove, the risk of losing money during a downturn. Investment choices in 529s are also limited. They offer fewer investment choices than most retirement plans, generally focusing on the most common investment needs of investors, not on more exotic choices.
Literature Review
With an average four-year cost of more than $100,000,10 college education is one of the most expensive and most common saving decisions for an American household. According to Fisher and Montalto (2010), education of children or grandchildren is the third most popular saving motive (17 percent) in a household, after retirement (49 percent) and emergencies (35 percent).
Studies have found a link between increased college savings and outcomes, such as increased college attendance (Cheatham and Elliott 2013; Elliott and Nam 2012; Elliott and Beverly 2011). While the average amount saved for college has increased by 54 percent over the past five years, according to Sallie Mae,11 more can be done to help parents make optimized decisions regarding college education and finances.
Many studies have examined ways that public policy can be designed to help nudge people into making better decisions about college education. For example, Yeung and Nguyen-Hoang (2019) found that regularly texting college tips and reminders to urban public high school students increased enrollment and persistence in college. Bettinger, Long, Oreopoulos, and Sanbonmatsu (2012) found that helping low- and moderate-income families complete the Free Application for Federal Student Aid (FAFSA) helped increase their likelihood to submit the aid application, enroll in college, and receive financial aid.
Some researchers have studied how to encourage people to save more for their children’s college education. For example, Sherraden, Johnson, Elliott, Porterfield, and Rainford (2007) examined a college savings program for public elementary school children that aimed to teach them financial knowledge while matching their financial contributions for college. The researchers discovered that families can save, and that program structures that require regular saving would improve saving rates and regularity of contributions. Another study by Elliott, Song, and Nam (2013) reviewed the relationship between children’s small-dollar savings accounts and college enrollment and graduation rates using data from the Panel Study of Income Dynamics. They found that children from low- and moderate-income households may be more likely to enroll in and graduate from college when they have small-dollar savings accounts with money designated for school.
Previous studies on retirement savings (including Benartzi and Thaler (2007); Choi, Laibson, and Madrian (2009); Choi, Laibson, Madrian, Metrick, McCaffrey, and Slemrod (2006); and Cribb and Emmerson (2016)) also provide insight on how we can nudge households to save more for their children’s college education. Madrian and Shea (2001) found they could increase participation rates by more than 30 percent by defaulting people into a retirement plan (and giving them full freedom to exit it). This demonstrates that government and industry have many opportunities to help households reach better financial outcomes.
Finally, a smaller body of research has focused on interventions that nudge parents to increase savings in 529s. Long and Bettinger (2017) tested how different ways of conducting workshops on 529s affect long-term savings behavior and postsecondary outcome. Beverly, Clancy, and Sherraden (2016) examined the effects of automatic, universal, and progressive child development accounts in Oklahoma and found that the automatic opening of 529 accounts and initial $1,000 deposits may enable children to amass significant assets over time. Clancy, Han, Mason, and Sherraden (2006) evaluated the effect of Maine’s matching grant program on participation and savings rates in 529s.
This study adds to the existing literature by focusing on simple visual interventions to shift a household’s savings allocations toward 529s and is an initial step to addressing the research gap that exists in this space.
Methodology
What do the potential benefits of 529 plans mean for actual American families? To answer this question, the subset of families with children under 18 was extracted from the 2016 Survey of Consumer Finances (SCF), a nationally representative sample of American households. Then, using data from Sallie Mae’s 2018 report, “How America Saves for College,” an estimate was made on how much each household in the SCF, on average, had already saved for their children’s education, and where they had saved (529s, other investment accounts, or checking/savings accounts). For both 529s and non-529 investment accounts, the same profile of fees was assumed, as well as the same glide path of stocks and bonds, based on Morningstar’s analysis of the median asset allocation used in 529s (Blanchett and Stempien 2013). It was also assumed that a diversified portfolio of stocks provided real returns of 7.1 percent, with a standard deviation of 19.7 percent; bonds provided real returns of 3.2 percent with a standard deviation of 7.08 percent; and savings accounts had a 0 percent real return with no variability.
For each SCF household, an alternative scenario was considered: what would happen if, at the birth of each child, the family had directed those education savings into a 529 instead of other vehicles? How would the potential benefits of 529s translate into additional money for each family?
Throughout the analysis, each family’s contribution rate was left unchanged; this analysis looked at the effect of using a 529 instead of other vehicles. As a result, families already using a 529 plan received no incremental tax benefit.
For each household, the following was calculated:
Marginal state income tax rate, federal capital gains tax rate, and state capital gains tax rate (usually the same as their state income tax rate, but not always), based on their estimated state and federal income. For families in high-tax, high-deduction states, the more they contributed, the greater the benefit (subject to caps). Similarly, the more money they had to contribute to 529s, the greater the potential capital gains benefit.
The maximum 529 deduction they could receive, given their marital status, number of children, and their likely state of residence.12
State tax benefit, which was calculated by taking the household’s 529 tax deduction, based on their new contributions and subject to their maximum deduction, multiplied by their state income tax rate.
Post-tax investment benefit, which was the difference in their education savings (at the start of college) if the money held in a savings account was instead placed in an investment account.
Capital gains tax benefit from avoiding capital gains tax on those investments. All gains were taxed annually to allow for separate analysis of the tax benefit of investing.
This study repeated this process across 1,000 different randomly generated market return paths in a Monte Carlo simulation to determine the distribution of outcomes across market conditions. All calculations and values are in real terms (adjusted for inflation). The individual results were then aggregated to the entire population of American households saving for their children’s education.
Results
If American households used 529 plans exclusively for college savings, they would realize $237 billion in more savings by the time their children attended college, under normal market conditions. For the average family saving for college (the 56 percent of households that self-report saving for college among the roughly 38 million households with children under 18), this comes to $4,044 per child.
The $237 billion in additional wealth comes from three sources: (1) $26 billion in unused state tax benefits; (2) $50 billion in unused capital gains tax benefits; and (3) $161 billion in the post-tax benefit of investing college savings.
The largest single benefit of 529 plans comes from moving existing savings into an investment account and earning higher returns in exchange for additional risk. To be clear, this is not a benefit that occurs solely with 529s; it’s one that all investment accounts share. Many families use savings and checking accounts instead of investment accounts to hold their college savings, and 529s simply encourage families to invest those funds. Other investment vehicles could provide the same benefit—but as shown in the Sallie Mae data, they simply aren’t utilized as often.
It is important to remember that with investing comes risk, however. As mentioned above, these values are averages under normal market conditions. The median value (50th percentile) is $183 billion. Under adverse market conditions (20th percentile), the benefit is $33 billion; $15 billion from investing, and $18 billion from state tax benefits on contributions (this study did not model tax-loss harvesting).
Figure 1 shows the per-child benefit in each of these areas compared with the average allocation for college savings. Of the average $4,044 total per child outcome under normal market conditions, $2,763 comes from investing otherwise uninvested funds. The added benefits from the unique aspects of 529s—capital gains and income tax incentives—provide $839 and $442 per child, respectively. In total, this represents an opportunity to borrow less for college.
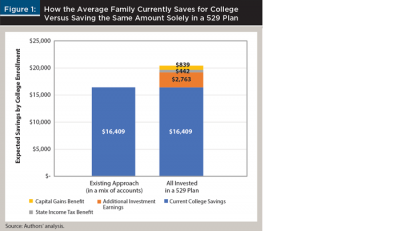
To look at these savings another way, the average family could save 25 percent less and still have the same amount available when their child is ready for college by saving all of those funds in a 529 with a standard glide path to reduce risk exposure over time. That 25 percent change is compared with the current average approach for college savings, in which families place savings in a mix of accounts. These average gains, however, are not evenly distributed.
Distribution of Benefits
Previous research has addressed the expected distribution of these gains, suggesting that affluent families are the primary beneficiaries of 529s (Dynarski 2004). Data from Sallie Mae show high-income families are more likely than middle- and low-income families to use 529 plans.13
This analysis adds to the previous literature by quantifying who would benefit by reallocating their remaining college savings into 529 vehicles, not who benefits currently (see Table 1).

A benefit of 529 plans is that savings are invested instead of being held in a low-yield savings or checking account. Because of this, middle-class Americans would benefit from 529s the most (higher-income families already use 529s or other investment vehicles, and lower-income families generally don’t have enough saved to see any substantial benefit). More specifically, upper-middle-income families (earning between $75,000 and $100,000 per year) tend to not invest their college savings and could benefit the most by shifting to a 529. With their current allocation, middle-income families are potentially foregoing thousands of dollars in investment earnings.
Tax Benefits Depend on Location
Two other benefits of 529s—state income and capital gains tax incentives—are straightforward. For families in high-tax, high-deduction states, the more they contribute, the greater the benefit (subject to caps). Similarly, the more money they have to contribute to 529s, the greater the potential capital gains benefit. In both cases, the wealthier benefit because saving for college education increases with income. According to Sallie Mae, the average family saving for college with less than $35,000 annual income has $3,626 saved (averaged across families with children of all ages), and families with income higher than $150,000 annual income have $35,000 saved.
What does this mean for a given family and the variations across families? Consider, for example, a married couple with two children ages 4 and 7, earning $73,000 a year, with total college savings of $20,000 all in savings accounts. If they lived in California, a state with no 529 deduction, and maintained that rate of saving until their children were 18, they would have roughly $40,000 per child. If they invested that money in a 529 plan, they could have more than $49,000 per child for college. Is the $9,000 difference worth the added risk that comes from investing? It depends on their preferences, goals, and broader financial picture. Similarly, if this family lived in Illinois, they would have $51,700 per child because of the tax benefits specific to that state.
While this analysis focused on the aggregate benefit across real American households, the per-household costs and benefits vary for economic and other reasons. The key finding is that the financial benefits of 529s are considerable, driven by moving existing funds from savings accounts into investments.
Interventions to Increase Allocations to 529s
In the second part of this study, a proof of concept experiment was conducted to test potential interventions to increase parents’ college savings allocations to 529s. The study consisted of three components: (1) gathering data about the participants’ current and future educational savings plans; (2) applying one of four randomly assigned interventions intended to increase 529 plan contributions; and (3) gathering demographic information about the participants for subsequent analysis.
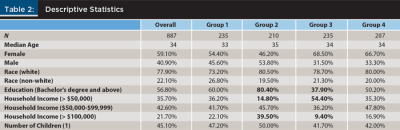
Participants. Participants were recruited in September and October of 2018 using Prolific.co, a data collection platform developed for the research community to survey individuals across the globe on a variety of topics. Participants were paid a baseline fee of $1.00 for completing the survey. The study consisted of 887 participants who were U.S. residents and had children under the age of 18. The survey instrument did not allow participants to skip any questions. Participants were divided into four groups based on their savings and 529 plan behavior (see Table 2).
Experimental design. Participants were asked to identify what college savings investment vehicles they were familiar with, and if they were currently saving for their children’s college education.
Participants who indicated they’ve been saving for their children’s college education were asked to provide the amounts they planned to save in 2019 and an initial percentage allocation breakdown by investment vehicle, including certificate of deposit, checking account, investment account outside of a 401(k) and 529 plan, savings account, 529 plan, other education plans (such as prepaid tuition or Coverdell education savings plan), or “other.”
Participants who indicated they have not been saving for their children’s college education were asked to imagine they were provided with a hypothetical $1,000 in 2019 to save specifically for their children’s college education. They were then asked to provide an initial percentage allocation breakdown of their plan based on the investment vehicle types listed previously.
Each participant was randomly assigned to one of four experimental conditions that contained one of the following interventions:
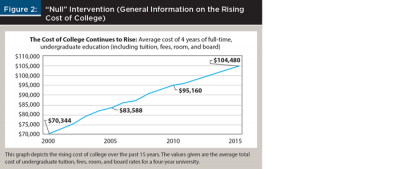
A null intervention (“Null”) that provided general information about the rising cost of college. This intervention was the control. (See Figure 2.)
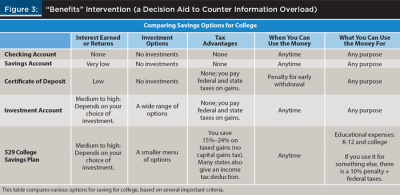
A table summarizing the benefits and drawbacks of 529s (“Benefits”) designed to overcome the problem of information overload with 529s. It approximates a standard table graphic that several financial websites currently use to compare 529s with other types of college education saving vehicles. (See Figure 3.)
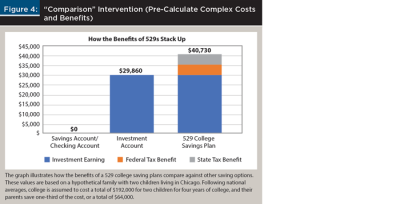
A graph quantitatively comparing the financial benefits of 529s (“Comparison”) against other account types designed to overcome the challenge of calculating complex costs and benefits. This is a new type of informational graphic developed from the calculations from the first part of this study to quantify the financial benefits of using a 529 compared to other types of vehicles. (See Figure 4.)
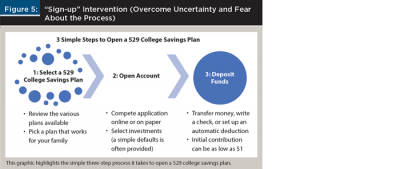
An infographic showing how to sign up for 529s (“Sign-up”) designed to overcome uncertainty and fear about the sign-up process. (See Figure 5.)
After being exposed to their randomly assigned interventions, participants had an opportunity to revisit and revise their initial percentage allocation breakdown. They were then asked general demographic questions and their opinions about saving for their children’s college education.
The independent variable was the intervention that the participants were exposed to. The dependent variable was the average percentage point change between the participant’s initial, pre-intervention savings percentage allocation to 529s and their revised, post-intervention savings percentage allocation to 529s. The average percentage point change was chosen to standardize the effects of the interventions.
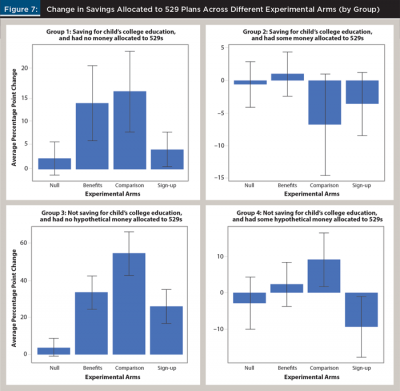
The participants were analyzed as a whole and as four subgroups based on their responses to two questions in the survey. Group 1 (235 participants) were currently saving for their child’s college education but had no money allocated to 529 plans. Group 2 (210 participants) were also saving for college and had some money allocated to 529s. Group 3 (235 participants) were not saving for their child’s college education and had no hypothetical money allocated to 529 plans. And Group 4 (207 participants) were not saving for college but had some hypothetical money allocated to 529s.
The focus of this analysis was on Group 1—parents saving for college education but did not initially plan to use 529s. The secondary group was the parents who were currently saving for college and had initially planned to allocate at least some of their savings to a 529 (Group 2). According to Sallie Mae, the average family that already uses a 529 account uses it for over 72 percent of their college savings.14 In other words, when people have a 529 plan, it tends to be their primary college savings vehicle. Although contributing more to an existing 529 plan appears to be a lesser issue than opening a 529, some improvement can be made here.
For Groups 3 and 4, many of these families either did not plan on their children attending college, did not have the money to save for their children’s college education, or decided not to save for their children’s college education. Their hypothetical allocations of savings were used to note the similarities and differences in their decision-making with Groups 1 and 2.
Results
The demographic breakdown for each group was similar across the four groups in terms of age and race. However, Group 2 and 3 had some differences in educational background and household income. As shown in Table 2, Group 2 generally attained a higher level of education and a higher household income than the overall pool. Group 3 generally attained a lower level of education and a lower household income than the overall pool. This corresponded to survey data from Sallie Mae and the first study in this paper, which found that participants who used 529s were mostly wealthy households.
A one-way between subjects ANOVA was used to compare the effect of various behavioral interventions (independent variable) on planned savings allocations in 529s (dependent variable).
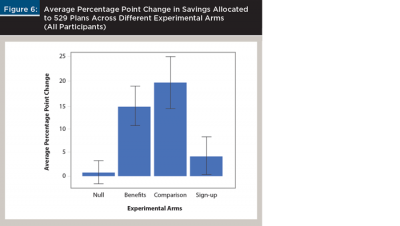
“Benefits” and “Comparison” behavioral interventions were effective. A one-way between subjects ANOVA was conducted on all three interventions on the general sample (Groups 1 through 4) and the average change in allocation was found to be significant, suggesting that at least one of the behavioral interventions was significantly different from the rest [F (3, 883) = 17.06, p < 0.001].
A Tukey honestly significant difference (HSD) test indicated the mean score for the “Comparison” intervention (M = 19.2; SD = 39.9) and “Benefits” intervention (M= 14.3; SD = 32.2) were significantly different than the null intervention (M = 0.701; SD = 17.5) at the 5 percent significance level. The effect size for the “Comparison” and “Benefits” interventions (d = 0.60 and d = 0.52) were also found to exceed Cohen’s (1988) convention for a medium effect (d = 0.50). However, the “Sign-up” intervention (M = 4.07; SD = 29.0) did not significantly differ from the null intervention.
Figure 6 demonstrates the results from the experiment for the general sample. These results suggest that parents faced difficulties with information overload and calculating complex costs and benefits when dealing with the issues of college savings. This inhibited them from even looking into 529 as an option. Figure 7 breaks down the results by Group.
One possible explanation for these results is that with hypothetical values, participants took cues from the study and increased their allocation to 529s; however, that does not appear to be the case, at least not in full. The behavioral intervention, focusing on reducing fear and uncertainty of the sign-up process, did not appear to significantly increase average allocations in 529 accounts. This suggested that the study context itself was not enough to show an increase in 529 contributions, and that without a demonstration of the clear financial benefit of investing in a 529 account, clarity on the sign-up process will not push the needle for parents.
It is worth noting that the “Comparison” intervention (which is uncommon in the field) prompted an equal or higher average allocation than the “Benefits” intervention (which is similar to approaches used by existing online materials). This means that providing parents with a quantitative comparison of the financial benefits of 529s against other account types can be more effective than just providing a summary of the benefits and drawbacks of 529s against other account types. The added dimension of providing a dollar amount to the financial benefits may have made the “Comparison” intervention more concrete to nudge parents to select 529s as their investment vehicle for their children’s college education.
College-saving parents who did not initially plan to save in 529s responded well to the “Comparison” and “Benefits” behavioral interventions. Group 1 had a similar result as the general sample. For these college-saving parents, we found that at least one behavioral intervention had a significant effect on planned savings allocations in 529s [F (3, 231) = 4.641, p = 0.00359].
A Tukey HSD test indicated that the mean score for the “Comparisons” intervention (M = 15.6; SD = 31.2) and “Benefits” intervention (M = 13.3; SD = 30.4) were significantly different than the null intervention (M = 2.17; SD = 13.2) at the 5 percent significance. However, the “Sign-up” intervention (M = 4.04; SD = 13.1) did not significantly differ from the null intervention. The effect size for “Comparison” and “Benefits” interventions (d = 0.57 and d = 0.47) were also found to exceed Cohen’s (1988) convention for medium and small effect, respectively.
These results suggest that while these parents were committed to saving for their children’s college education, they faced difficulties with information overload and calculating complex costs and benefits when making choices on the appropriate investment vehicles. The easiest defaults are often savings accounts. This inhibited them from even looking into a 529 as an option.
Non-college saving parents who did not initially plan to save in 529s responded to all behavioral interventions. For Group 3, a Tukey HSD test indicated that the “Comparison” (M = 54.3; SD = 43.4), “Benefits” (M = 33.4; SD = 39.5) and “Sign-up” (M = 25.7; SD = 33.9) behavioral interventions all had a significant effect on average allocations in 529 accounts [F(3, 231) = 18.3, p < 0.01] when compared to the null intervention (M = 3.63; SD = 17.4). These results suggested that in hypothetical allocation situations, behavioral interventions that reduce anxiety and complexity about the sign-up process will also help nudge participants into allocating more into 529s. It may also mean that hypothetical allocations are less sticky and more prone to suggestion by behavioral interventions. The effect size for “Comparison,” “Benefits,” and “Sign-up” interventions (d = 1.51, d = 0.92, d = 0.81) were also found to exceed Cohen’s (1988) convention for a large effect respectively.
Interventions not effective for parents who had already planned to allocate some money into 529s. For parents who had initially planned to allocate some money into 529s (Groups 2 and 4), the behavioral interventions had no significant effect on increasing planned savings allocations in 529s relative to the control group ([F(3, 206) = 1.794, p = 0.149], [F(3, 203) = 4.412, p = 0.00496]).15 As previously mentioned, parents who use 529s already allocate most of their money in 529 accounts; therefore, behavioral interventions have limited opportunity to make a difference. Fifty-five percent of participants in Group 2, and 47 percent of participants in Group 4 already allocated 100 percent of their college savings into 529s prior to being shown the behavioral intervention.
Limitations
This study has three limitations. First, it used an online convenience sample of self-reported American parents rather than a nationally representative sample. Prior research has found similarities between online panels (particularly Mechanical Turk) and nationally representative samples, but that can never be guaranteed in a study (Berinsky, Huber, and Lenz 2012)
Second, it relied on self-reported and planned figures. For all the reasons for behavioral obstacles to saving—i.e., the intention-action gap—we should doubt the one-to-one relationship between intentions and actions. If people increase their intention to save, it will not decrease their subsequent action. The true effect is likely to be muted in magnitude, relative to the hypothetical scenario, but in the same direction.
Lastly, social acceptability bias is another factor to consider. Because the study is specifically about 529 plans, and there is no easy way to mask that fact and still provide meaningful interventions, we would expect that participants would inflate their self-reported planned 529 contribution rates. The fact that participants had responded unevenly to the three behavioral interventions did indicate a real signal on the effectiveness of the “Comparison” and “Benefits” interventions when applied to our main target group of college-saving parents who did not plan on allocating any money into 529s.
Implications and Conclusions
Money is being left on the table by families who do not invest for college—particularly in 529 plans. If U.S. families were to make better use of 529s, they could increase their collective funds for college by over $237 billion dollars under normal market conditions. Under adverse conditions (20th percentile), families would still benefit by over $33 billion dollars, particularly because of the state and federal tax benefits.
The average family would see a benefit of $4,044 per child, and there is a wide variation across families—those who can benefit, benefit greatly. Because of this variation and the risks inherent in 529s, they aren’t right for everyone—even among those families that are already putting aside considerable amounts for their children’s education in other vehicles. An individual-level analysis is necessary so that families that would benefit significantly are provided support to enroll, and those who wouldn’t are given other appropriate options.
For those who would benefit from saving for college, providing all the information on the financial benefits of 529s might not substantially change behavior. The benefits of 529s are already there for families, and they fail to use them. Research in behavioral science on retirement savings has shown how seemingly minor details of the sign-up process and framing of savings can drastically limit participation (Thaler and Benartzi 2004).
Parents might be put off by the apparent complexity of the sign-up process, the overwhelming information one could analyze to decide whether to use 529s, and uncertainty about whether 529s could really help them.
Results of this experiment suggest that behavioral interventions focused on highlighting the quantified financial benefit of investing in a 529 account and reducing the information overload on college saving investments was effective in encouraging parents to allocate money into 529 accounts. Specifically, the illustration comparing the estimated monetary differences between vehicles (the “Comparison” intervention), which appears to not be commonly used in the field, showed equal or higher effects than a more standard illustration of the benefits between vehicles. However, further research into other types of non-visual interventions that can be introduced to nudge families to opt-in to 529s to better save for their children’s college education is needed.
Financial planners can adapt the graphs and interventions included in this research for their clients in order to encourage them to adopt 529s to save for their children’s college education.
Endnotes
1. Based on College Savings Plan Network data on the assets in 529 plans ($329 billion as of mid-2018) and 2018 Sallie Mae/Ipsos nationally representative survey of households with children under 18, showing that, on average, families save 30 percent of their assets in 529s (see salliemae.com/assets/about/who_we_are/HAS2018_Full_Report.pdf). Because there is no single number for savings intended for college, this is an estimate based on the administrative data for 529s.
2. From “How America Saves for College 2018” assuming all 529 funds (30 percent), Coverdell (2 percent), and trust funds (2 percent) are invested, along with the self-reported external investment accounts (14 percent) and U.S. savings bonds (1 percent). In addition, and not included in this number, are 8 percent of funds that are in prepaid college tuition accounts, which arguably are a type of non-traditional investment.
3. Author’s analysis of data reported in Sallie Mae’s “How America Saves for College 2018” (salliemae.com/assets/about/who_we_are/HAS2018_Full_Report.pdf). The author verified with micro-data supplied by Sallie Mae and Ipsos, that 16.2 percent of families with children currently have savings in 529s. That represents 28.7 percent of the families with children under 18 who are saving for college education overall (56 percent of families with children save for college).
4. See Table F-1 from the 2016 Census CPS summary at www.census.gov/data/tables/2016/demo/families/cps-2016.html.
5. Amount spent, on average, from parental and child savings as a proportion of total cost, after grants and scholarships. Author’s calculations based on Sallie Mae’s “How America Pays for College 2017,” Table 1a (salliemae.com/assets/Research/HAP/HowAmericaPaysforCollege2017.pdf).
6. According to Sallie Mae, of the money that families save, roughly 40 percent are invested in education savings accounts (30 percent in 529s; 8 percent in prepaid tuition plans; 2 percent in Coverdells), and another 17 percent are invested in other, non-tax advantaged vehicles.
7. For an analysis of the tax alpha of 529 plans, see Delorme (2019).
8. Fifty-five percent of the U.S. population lives in states that have an income tax and offer an income tax deduction or credit of at least $1,000 a year. Based on the author’s calculations using FinAid.org’s summary of state-by-state deductions at finaid.org/savings/state529deductions.phtml.
9. See savingforcollege.com/article/college-savings-penalties.
10. National Center for Educational Statistics’ average total tuition, fees, room and board rates charged for full-time undergraduate students in four-year institutions (public and private) for the 2016–17 academic year (nces.ed.gov/fastfacts/display.asp?id=76).
11. See salliemae.com/assets/about/who_we_are/How_America_Saves_for_College_Infographic.pdf.
12. The public SCF data does not provide state of residence. Therefore, a Monte Carlo simulation was conducted, randomly assigning individuals to states based on their relative population size. While one’s state can matter considerably for an individual, the location of a particular individual (subject to the observed population distribution) has little effect in aggregate.
13. “How America Saves for College 2018,” shows 37 percent of high-income families’ colleges savings are in 529s, compared to 17 percent and 4 percent for middle- and low-income families.
14. See “How America Saves for College 2018” (salliemae.com/about/leading-research/how-america-saves-for-college).
15. Post hoc comparisons using the Tukey HSD test indicated that the results were irrelevant to the study; none of the interventions were significantly different from the null intervention. However, the graph intervention (M = 9.06; SD = 25.9) was significantly different than the infographic intervention (M = –9.40; SD = 32.5).
References
Benartzi, Shlomo, and Richard Thaler. 2007. “Heuristics and Biases in Retirement Savings Behavior.” Journal of Economic Perspectives 21 (3): 81–104.
Berinsky, Adam J., Gregory A. Huber, and Gabriel S. Lenz. 2012. “Evaluating Online Labor Markets for Experimental Research: Amazon.com’s Mechanical Turk.” Political Analysis 20 (3): 351–368.
Bettinger, Eric P., Bridget Terry Long, Philip Oreopoulos, and Lisa Sanbonmatsu. 2012. “The Role of Application Assistance and Information in College Decisions: Results from the H&R Block FAFSA Experiment.” Quarterly Journal of Economics 127 (3): 1,205–1,242.
Beverly, Sondra G, Margaret M. Clancy, and Michael Sherraden. 2016. “Universal Accounts at Birth: Results from SEED for Oklahoma Kids.” CSD Research Summary No. 16-07. Washington University, Center for Social Development. Available at openscholarship.wustl.edu/cgi/viewcontent.cgi?article=1325&context=csd_research.
Blanchett, David, and Jeremy Stempien. 2013. “Morningstar 529 College Savings Index Methodology.” Morningstar Investment Management Research. Available upon request.
Cheatham, Gregory A., and William Elliott. 2013. “The Effects of Family College Savings on Postsecondary School Enrollment Rates of Students with Disabilities.” Economics of Education Review 33 (April): 95–111.
Choi, James J., David Laibson, and Brigitte C. Madrian. 2009. “Reducing the Complexity Costs of 401(k) Participation through Quick Enrollment.” In Developments in the Economics of Aging, 57–82. Chicago: University of Chicago Press.
Choi, James, David Laibson, Brigitte C. Madrian, Andrew Metrick, Ed McCaffrey, and J. Slemrod. 2006. Behavioral Public Finance: Toward a New Agenda. New York, N.Y.: Russell Sage Foundation.
Clancy, Margaret, Chang-Keun Han, Lisa Reyes Mason, and Michael Sherraden. 2006. “Inclusion in College Savings Plans: Participation and Saving in Maine’s Matching Grant Program.” CSD Research Report No. 06-03. Washington University, Center for Social Development. Available at csd.wustl.edu/06-03.
Clancy, Margaret, Peter Orszag, and Michael Sherraden. 2004. “College Savings Plans: A Platform for Inclusive Saving Policy?” CSD Perspective No. 04–25. Washington University, Center for Social Development. Available at csd.wustl.edu/04-25.
Cohen Jacob. 1988. Statistical Power Analysis for the Behavioral Sciences. Hillsdale, N.J.: L. Erlbaum Associates.
Cribb, Jonathan, and Carl Emmerson. 2016. “What Happens When Employers Are Obliged to Nudge? Automatic Enrolment and Pension Saving in the UK.” Institute for Fiscal Studies working paper No. W16/19. Available at ifs.org.uk/publications/8733.
Delorme, Luke. 2019. “College Savers: What Is the Expected Tax Alpha of 529 Plans?” Journal of Financial Planning 32 (11): 44–52.
Dynarski, Susan M. 2004. “Who Benefits from the Education Saving Incentives? Income, Educational Expectations, and the Value of the 529 and Coverdell.” National Bureau of Economic Research Working Paper No. w10470. Available at nber.org/papers/w10470.
Elliott, William, and Sondra Beverly. 2011. “Staying on Course: The Effects of Savings and Assets on the College Progress of Young Adults.” American Journal of Education 117 (3): 343–374.
Elliott, William, and Ilsung Nam. 2012. “Direct Effects of Assets and Savings on the College Progress of Black Young Adults.” Educational Evaluation and Policy Analysis 34 (1): 89–108.
Elliott, William, Hyun-a Song, and Ilsung Nam. 2013. “Small-Dollar Children’s Savings Accounts and Children’s College Outcomes.” Children and Youth Services Review 35 (3): 560–571.
Fisher, Patti J., and Catherine P. Montalto. 2010. “Effect of Saving Motives and Horizon on Saving Behaviors.” Journal of Economic Psychology 31 (1): 92–105.
Long, Bridget Terry, and Eric Bettinger. 2017. “Simplification, Assistance, and Incentives: A Randomized Experiment to Increase College Savings.” Harvard working paper. Available at pdfs.semanticscholar.org/135a/1360cbfb36dbac34032c07cc1d080cc850f6.pdf.
Madrian, Brigitte C., and Dennis F. Shea. 2001. “The Power of Suggestion: Inertia in 401(k) Participation and Savings Behavior.” The Quarterly Journal of Economics 116 (4): 1,149–1,187.
Sherraden, Margaret S., Lissa Johnson, William Elliott III, Shirley Porterfield, and William Rainford. 2007. “School-Based Children’s Saving Accounts for College: The I Can Save Program.” Children and Youth Services Review 29 (3): 294–312.
Sherraden, Michael. 2009. “Savings and Educational Attainment: The Potential of College Savings Plans to Increase Educational Success.” CSD Policy Brief 09–29. Washington University, Center for Social Development. Available at csd.wustl.edu/09-29.
Thaler, Richard H., and Shlomo Benartzi. 2004. “Save More TomorrowTM: Using Behavioral Economics to Increase Employee Saving.” Journal of Political Economy 112 (S1): S164–S187.
Yeung, Ryan, and Phuong Nguyen-Hoang. 2019. “Using Texting to Nudge Urban Public School Students to and Through College.” Journal of Research on Technology in Education 52 (1): 113–127.
Citation
Leung, Michael, and Steve Wendel. 2020. “The Financial Impact of Not Using 529 Plans, and Behavioral Interventions to Increase Usage.” Journal of Financial Planning 33 (4): 44–55.