Journal of Financial Planning: June 2011
Robert J. Atra, Ph.D., CFA, is a professor and chair of the finance department at the College of Business at Lewis University in Romeoville, Illinois.
Thomas L. Mann, Ph.D., CFP®, is a financial economist in Sarasota, Florida.
Executive Summary
- Dollar-cost averaging (DCA) is an investment technique commonly suggested by financial planners and investor websites. While much empirical evidence casts doubt on the benefits of DCA, this paper investigates whether tax options that arise because of DCA investing are enough to offset its lack of benefits.
- Our study suggests that although DCA does have a tax advantage over lump-sum (LS) investing, the advantage does not make the technique superior to LS.
- Furthermore, we briefly investigate an issue not frequently addressed in the literature, the receipt of dividends, and determine that the inclusion of dividends favors LS as an investment strategy as well.
- Overall, our results suggest that in many practical scenarios DCA is not as beneficial as practitioners suggest. On the other hand, DCA is not as economically inferior as some academics have claimed.
Dollar-cost averaging (DCA) is an investment technique whereby similar amounts are invested periodically as opposed to a single, lump-sum (LS) payment at the beginning of the period. References to DCA in financial “how-to” books and financial websites are ubiquitous. Some academic literature has suggested reasons for the prevalence of DCA in practitioner circles. Statman (1995) suggests the use of DCA is a behavioral phenomenon, in which investors can minimize regret by investing periodically. Atra and Mann (2001) show that DCA may be a way for investors to time seasonal patterns in both domestic and international stock markets. Dubil (2005) indicates that DCA may be a way to reduce risk as opposed to purely enhance returns.
It appears that the preponderance of academic literature, however, is less complimentary to DCA as a technique. Studies that indicate DCA is suboptimal when compared to LS include Williams and Bacon (1993), Knight and Mandell (1993), Rozeff (1994), and Bierman and Hass (2004). More recently, Greenhut (2006) has referred to DCA as a “mathematical illusion.”
The purpose of this study is to extend the analysis in a couple of directions not previously inspected. First, our analysis will be on an after-tax basis. Because DCA is frequently suggested as an investment program for individual investors, taxes could play a significant role in determining the effectiveness of the strategy. Furthermore, the after-tax analysis will deconstruct returns into two components—a “pure investing” component, which will allow comparison of our results with previous studies, and a “tax shelter” component, which will allow us to directly view the tax benefits of DCA. Finally, we will attempt to explicitly estimate the effect of dividend returns on the comparison of DCA and LS strategies.
After-Tax Analysis and the Tax Option
Previous research on DCA and LS has ignored the effect of taxes on choosing between the two strategies. Jeffrey (1995), however, forcefully argued that taxes should be an important consideration in choosing between investment strategies. Given that the DCA strategy purchases stock throughout the year while the LS strategy invests in stock at a single point in time, there could be substantial tax differences associated with the respective strategies because of the different bases paid for the stock.
According to the U.S. tax code, investors may use the method of specific identification when selling stock. Because it is usually in investors’ best interests to sell the highest-basis stock in their portfolios, the tax code grants them a “tax option” when liquidating. In other words, investors may choose a highest in, first out (HIFO) strategy when liquidating stock in order to shelter as much of the sales proceeds as possible from taxes. Even if an investor completely liquidates an account and exhausts all bases, the investor likely will still choose HIFO because of time value of money considerations. An investment strategy that generates a wider range of bases, therefore, may have superior after-tax wealth accumulation because the investor has more options when choosing which stock to sell.
In order to better understand the effect of taxes, the following formula can be used to determine after-tax proceeds from a sale of stock:
ATP = PL – (PL – BL)(T) (1)
where
ATP = after-tax proceeds from sale
PL = price of stock being liquidated
BL = basis of stock being liquidated
T = tax rate
and after rearranging,
ATP = PL(1 – T) + BLT (2)
Equation 2 has the advantage of breaking down after-tax proceeds into “pure investment” and “tax shelter” components. The first term on the right-hand side of Equation 2 can be interpreted as the after-tax proceeds available from the sale of an investment that had a zero basis for tax purposes (BL = 0). This would be the case, for instance, when investments are made into a tax-deductible, tax-deferred retirement account, such as a traditional IRA. The second term on the right-hand side of Equation 2 represents the amount of taxes that can be sheltered by deducting the basis. In a traditional taxable account, BL becomes a major influence on after-tax returns. At T = 0, tax effects disappear from Equation 2, and any resulting analysis would only apply to a completely tax-free account.
Because investors may choose the highest-basis stock when liquidating, strategies that yield a wider range of bases may yield greater returns on an after-tax basis. With the technique we use in this study, the LS investments are made only once per year while the DCA investments are made monthly. Thus, the DCA strategy should provide a greater range of bases to choose from while liquidating and give the strategy a tax advantage, ceteris paribus (all else being equal), over LS.
Methodology
The LS strategy is accomplished by investing a sum of money at the beginning of the year into a stock account for each year of the investment period. To present a more realistic analysis, we assume that the amount invested at the beginning of each year increases at the Treasury bill rate. Therefore, much larger deposits are made toward the end of the investment period than at the beginning, consistent with a practical investment program that aims to make increasing real deposits. Such an investment program would be typical of an investor whose real income was rising over time.
The DCA strategy assumes the investor does not immediately invest in the stock account but instead invests the sum into a money market account paying the Treasury bill rate. At the beginning of each month, an amount is transferred from the money market account into the stock account leaving enough in the money market account to fund the remaining transfers. For example, with the DCA strategy, one-twelfth of the money market account would be transferred to the stock account at the beginning of January, one-eleventh of the remaining money market account would be transferred at the beginning of February, etc. The DCA investment into the stock account at the beginning of December would be the amount remaining in the money market account, and thus, would exhaust the money market account until the beginning of January when the next lump-sum equivalent deposit would be made.
Because we are assuming the accounts are taxable, several related issues arise. First, we use stock accounts that represent only the capital gain portions of return. Dividends, at least initially, are assumed to be spent and do not enter into the accumulation of the accounts. We will later revisit the dividend issue. By restricting the stock accounts to capital gains, we assume that taxes on the stock accounts are deferred until liquidation. In terms of the money market account, we assume that monthly returns are taxed at the current rate.
Our initial scenarios are assumed to have an investment period of 25–30 years and liquidation periods of 15 years (180 months). During the liquidation period, amounts are withdrawn from the DCA and LS accounts at the beginning of each month. The withdrawals are structured so that the accounts are exhausted over the 180 months. This is accomplished by liquidating a proportional amount from the accounts each month. For the first month, 1/180 is liquidated, for the second month 1/179 is liquidated, etc., until the account balance reaches zero at the end of the 180th month.
Because we are examining tax implications, bases are tracked throughout the investment period. Upon entering the liquidation period, we assume investors will liquidate the stocks with the highest basis first and will continue to do so as the stock accounts are drawn down. By liquidating high-basis stocks first, after-tax cash flows early in the liquidation phase are maximized. We then find the difference in after-tax cash flows between the DCA and LS strategies during the liquidation period and determine the present value of that difference as of the start of the liquidation period (beginning of retirement). The DCA and LS strategies are then compared based on their ability to generate the present value of after-tax cash flows.
Data
Three investment vehicles were chosen to compare the efficacy of DCA versus LS. We assume that investments could be made in funds that represent the S&P 500 (SP) Index as well as the Dow Jones Industrial Average (DJ). We further analyze the strategies based on investing in a single stock, Coca-Cola (KO). The three investment vehicles represent a span of stock investments in terms of diversification, growth, and risk. For simplicity, we assume that fractional shares can be purchased and liquidated.
As mentioned earlier, various scenarios were examined in order to test for robustness. The first scenario is one in which annual investments are made from 1960 to 1990 according to the LS and DCA strategies described above. The second scenario is run similarly, but investments are made from 1965 to 1990. Lastly, we test the consistency of our implications with shorter time frames by analyzing various starting times from 1965 to 1975 with 20-year investment periods and 10-year withdrawal periods.
One issue not addressed thus far is that of dividends. Dividends are problematic in that they represent periodic payments that must either be spent or reinvested. We assume that dividends are spent in order to greatly simplify the tracking of the stock bases. Furthermore, reinvested dividends tend to obfuscate the difference between DCA and LS as investing strategies, because the dividends would have to be reinvested periodically. Because frequent periodic investments are the hallmark of DCA, allowing dividends to be reinvested will tend to make the results of DCA and LS converge. Therefore, our treatment of dividends will allow for a stronger contrast of DCA and LS.
Our study assumes that although after-tax dividends are spent, their value is still reflected in the total value provided by the two strategies. In order to account for the spent dividends, we take the future value of after-tax dividends and compound them to the date that liquidation begins. While we still view the dividends as being “consumed,” the treatment of dividends here provides an estimate of the theoretical value of the consumed dividends at a common date.
Empirical Results
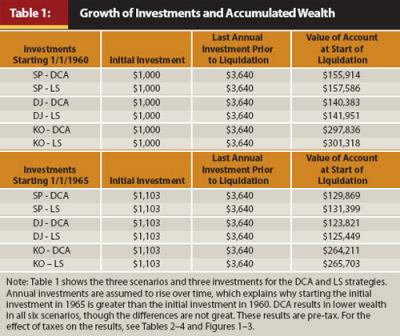
Empirical results for the different investments and time periods are presented in Tables 1–4. Table 1 presents the amount of money invested periodically and the amount to which each account grows as of the date liquidation begins. On a pre-tax basis, the two strategies yield similar ending wealth amounts.
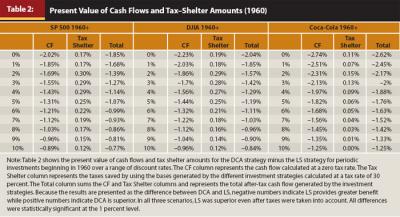
Tables 2 and 3 contain results for the three stock accounts and present relative differences between the DCA and LS strategies after tax shelters are factored into withdrawal computations. Some care must be used in interpreting the results of the tables. First, results are presented as the present value of the difference of the withdrawals that could be obtained between the DCA and LS strategy. Because the tables are constructed as the DCA withdrawal minus the LS withdrawal, a negative number implies LS is superior while a positive number indicates DCA performed better. In all cases we present results in which a 30 percent tax rate was assumed throughout the investment and liquidation periods.1
Withdrawals are spread over a timeline during the liquidation period. Because of the time value of money, their present value must be computed to allow for a comparison between the strategies. It is debatable what discount rate should be used in computing the present value, so we opt simply to present the results using a range of discount rates for comparison purposes and do not opine on what specific discount rate is appropriate. The discount rates are used to compute the present value of the after-tax cash flow difference as of the date liquidation begins.
Results in Tables 2 and 3 are presented separately according to the breakdown shown in Equation 2. Both the pure investment cash-flow and tax-shelter components are then summed to provide an analysis of the total value generated by DCA and LS. To facilitate understanding of the relative differences, a percentage value is presented. This value is the difference in the present value of liquidation period withdrawals as a percentage of the average of the values of the DCA and LS accounts at the beginning of the liquidation period. The percentage gives an idea, relative to the value of the account at the beginning of retirement, of the benefit of using one strategy as compared with the other.
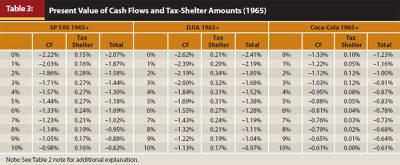
An examination of the annual strategies beginning in 1960 (Table 2) and in 1965 (Table 3) reveals some commonalities. In all six cases presented, the present value of the pure investment cash flows shows LS to be a superior strategy to DCA. Statistical tests were run on the entire time series of the differences between withdrawals from the DCA and LS strategies to determine whether they were significantly different from zero. A t-test on the differences was statistically significant at the 1 percent level for all scenarios. At reasonable after-tax discount rates, the additional value provided by the LS strategy is approximately 1 percent to 1.5 percent of the value of the account as of the beginning of the liquidation period. Given the volume of practitioner literature promoting DCA and academic literature condemning DCA, the percentage difference between the two strategies is surprisingly small. The results suggest there is not much economic significance to choosing either strategy. The greatest benefit of using the LS strategy shows up in the KO account starting in 1960, while the least benefit of using the LS strategy occurs in the KO account starting in 1965. LS proved a dominant strategy with consistent, albeit very small, percentage benefits.
As expected, the tax benefits from the DCA strategy are consistent. In all six cases the DCA strategy provides superior tax benefits, which, at normal discount rates, typically adds around 25 basis points to the value of the account at the beginning of the liquidation period for the diversified accounts, though much less for the KO account. Note that the tax benefits over the entire liquidation period do not nearly make up for the poor investment performance of the DCA strategy as indicated by comparing the cash-flow and tax-shelter columns.
Comparing the strategies across investment accounts shows striking similarity between the investment in the SP fund and the DJ fund in both the pure-investment and tax-shelter characteristics of the strategies. The results for the KO account provide additional support for LS as a preferred investing strategy. While the starting date has a much greater impact on the pure-investment returns for the KO account than it does on either the SP or DJ account, the LS provides greater after-tax cash flows given either starting date.
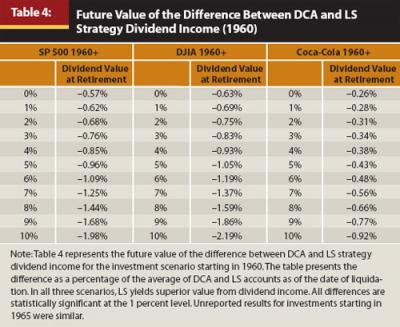
The analysis to this point has focused solely on capital appreciation. We have justified this on the grounds that we assumed dividends were simply consumed. That justification, however, creates an inaccuracy in comparing the DCA and LS strategies, as the two strategies do not yield the same dividend income. In fact, it is most likely the case that ignoring dividends understates the benefit of the LS strategy because that strategy assumes more is invested in the stock account, on average, leading to increased dividend income. To estimate the value of consumed dividends, we find the future value of the after-tax dividends as of the date liquidation begins. Once again, we do not opine about the compounding rate but present results for a range of rates. The future value is a theoretical number that can be thought of as the value of the consumed dividends. Consistent with the earlier analysis, the data are presented as the difference between the DCA and LS strategies, with negative numbers representing LS as superior.
Results for the dividend analysis are presented in Table 4 for the 1960–1990 investment period. As can be seen, investments in the SP and DJ accounts yield similar results for the dividend adjustment. Assuming the after-tax dividends could be compounded at 6 percent, the value added by the LS strategy was typically slightly more than 1 percent for the SP and DJ accounts, but much lower for the KO account at less than .5 percent. During the investment period, Coca-Cola’s rapid capital appreciation seems responsible for the small relative numbers. Overall, as expected, dividends do favor the LS strategy, with the benefit directly related to the dividend yield of the investment. Dividends from the LS strategy tend to increase the value of the account by about 1 percent above that of the DCA strategy and, by themselves, far outweigh the impact of the DCA tax savings.
Although DCA does provide some additional tax shelter over LS, one question is how long that tax shelter is likely to last. In order to examine the benefit of DCA over the liquidation period, we track a time series of cash flows for both the DCA and LS strategies. At each month of liquidation, both pure-investment and tax-shelter cash flows are plotted to yield insight as to how long a liquidation period must be for DCA to provide superior cash flows to LS. Figures 1 and 2 present the initial scenarios—three different stock investments and two different starting dates for each.
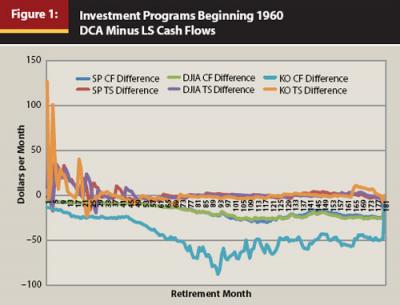
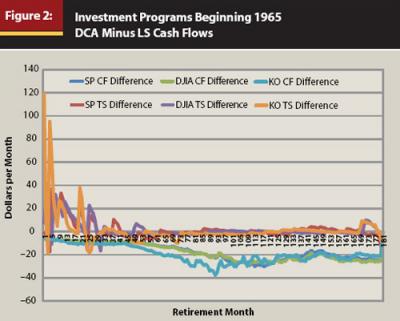
The patterns of cash flows over time for the three different investment vehicles are similar. One can see that for all three accounts, substantially all of the tax benefits from the DCA strategy occur in the first two years, and that tax benefit often exceeds the “pure-investment” cash-flow benefit from the LS account. The tax benefits dissipate rather quickly, however, and tend not to have much of an impact beyond the third year. Note also the saw-tooth pattern of the tax benefits. This pattern is to be expected because the tax shelter is generated by selling the stock with the highest basis first. As the range of high-basis DCA stocks are exhausted, the investor must dip into lower-basis DCA stocks for which the bases are falling relative to equivalent LS basis stocks. Only after that tranche of LS stocks has been exhausted does the DCA tax benefit spike up again. The pattern for KO appears similar, yet exaggerated.
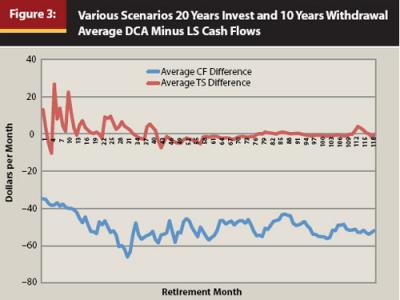
To examine the robustness of the initial scenarios, we ran similar tests on several alternative periods with shorter investment and liquidation periods. The three investment vehicles previously mentioned were tested with an investment period of 20 years and a withdrawal period of 10 years at starting points in 1965 and 1975. We include the average results in Figure 3. The average results for the alternative scenarios yield implications very similar to our initial tests. DCA provides tax benefits that dissipate rather quickly—within approximately two to three years—while LS provides superior cash flows.2
Conclusion
DCA is often viewed by practitioner literature and websites as an ingenious way to accumulate wealth, though much empirical evidence casts doubt on those claims. This study examined several practical issues and scenarios comparing DCA to LS investing. The main thrust of the study was to investigate whether DCA has superior tax advantages to LS given the wider range of stock bases the DCA strategy would generate. Based on a sample of investment vehicles and time periods, our empirical evidence does suggest that DCA produces some tax benefit associated with selling higher-bases stock. That tax benefit, however, does not make up for the loss of wealth accumulation of the DCA strategy compared with the LS strategy. In all of our most practical scenarios, where an investment period of 25–30 years is followed by a liquidation (retirement) period of 15 years, DCA would lead to small reductions in after-tax cash flows during liquidation. The present values of the reductions are generally around 1 percent to 2 percent of the value of the portfolio at the date of retirement. Furthermore, a time-series analysis of the tax benefit of DCA shows that the tax shelters from the strategy are short-lived, fading usually within a couple of years after liquidation begins.
We also investigated the role of dividends. The LS strategy captured more dividend income than did the DCA strategy, and the value of dividends themselves outweighed the tax advantage DCA provided. When factoring in dividends received during the investment period, the LS strategy typically provided a 1 percent increase in the value of the portfolio.
In total, the LS strategy provided somewhat better accumulation of wealth from both capital gains and dividends, each typically adding more than 1 percent to the value of the portfolio when compared with DCA. In contrast, the tax benefit provided by DCA was approximately .25 percent for diversified portfolios.
There may be other reasons for using a DCA strategy, such as that it provides a convenient way to budget savings. However, even when factoring in one of the strengths of DCA, namely tax savings, the promotion of DCA as an investment strategy seems flawed. While our study is not exhaustive, the empirical results of our work for a representative sample of investments and realistic investment horizons provide additional evidence that DCA is certainly not a superior strategy. On the other hand, in the most realistic investing scenarios, our results suggest there is very little economic difference between DCA and LS.
Endnotes
- The model was also tested with varying tax rates. Those unreported results suggest the implications of this study were essentially the same even with higher and lower tax rates. A 40 percent tax rate did improve the performance of the DCA strategy, but not substantially.
- We also computed statistics on the alternative scenarios, such as those presented in Tables 1–4, with similar (unreported) results.
References
Atra, Robert J., and Thomas L. Mann. 2001. “Dollar-Cost Averaging and Seasonality: Some International Evidence.” Journal of Financial Planning (July): 98–105.
Bierman Jr., Harold, and Jerome E. Hass. 2004. “Dollar-Cost Averaging.” Journal of Investing (Winter): 21–24.
Dubil, Robert. 2005. “Lifetime Dollar-Cost Averaging: Forget Cost Savings, Think Risk Reduction.” Journal of Financial Planning (October): 86–90.
Greenhut, John G. 2006. “Mathematical Illusion: Why Dollar-Cost Averaging Does Not Work.” Journal of Financial Planning (October): 76–83.
Jeffrey, Robert H. 1995. The Portable MBA in Investment, ed. Peter L. Bernstein. Hoboken, NJ: John Wiley & Sons.
Knight, J. R., and L. Mandell. 1993. “Nobody Gains from Dollar-Cost Averaging: Analytical, Numerical, and Empirical Results.” Financial Services Review 2: 51–61.
Rozeff, Michael S. 1994. “Lump-Sum Investing Versus Dollar-Averaging.” Journal of Portfolio Management (Winter): 45–50.
Statman, Meir. 1995. “A Behavioral Framework for Dollar-Cost Averaging.” Journal of Portfolio Management (Fall): 70–78.
Williams, Richard E., and Peter W. Bacon. 1993. “Lump Sum Beats Dollar-Cost Averaging.” Journal of Financial Planning (April): 64–67.